FAQ
This page contains the answers to a number of frequently asked questions related to particulate matter and ozone pollution in the atmosphere. This list is not exhaustive and will be supplemented furtherin the future. If you have a question not in the list, or if you require further information, please do not hesitate to contact us at smog@irceline.be.
-
What is ozone?
Ozone is a highly reactive, unstable connection of three oxygen atoms. The word itself is derived from the Greek ozein, which means 'to smell'. Not without reason, because the gas has a typical odour that is sometimes noticeable in badly ventilated places with many (old) copying machines or after a thunderstorm with a lot of lightning. The chemical formula is O3.
Ozone in the ozone layer (in the stratosphere at a height of 15 to 45 km) protects the earth's surface against the harmful solar UV radiation.
Ozone in the lower air layer (the troposphere) at ground level is formed on hot days by the influence of sunlight (UV of ultraviolet light) on air polluted with nitrogen oxides and volatile organic compounds.
-
When is there too much ozone?
A number of conditions have to be met before too much ozone occurs in the lower atmosphere (at ground level):
- weather has to be sunny (lots of UV light). Clouds stop UV radiation emitted by the sun ( to a high degree).
- it has to be sufficiently warm (>25 °C).
- wind has to come from continental direction (E,SE,S) with low wind speed.
- enough nitrogen oxides (NOx) and volatile organic compounds (VOC) have to be present in the atmosphere, and in correct ratios.
The (simplified) chemical reaction of ozone formation can be found here. It is important to state that a single day with sunny and warm weather does not lead to exceedances of the ozone threshold most of the time. Longer periods with such conditions are (most often) necessary.
An excess of ozone at ground level ('ozone smog') only occurs in Belgium during the months of May, June, July and August, or exceptionally during the end of April or the first half of September, in periods with a high pressure system located above continental Europe combined with eastern to southeastern wind currents towards Western Europe.
An overview of the number of 'ozone days' (i.e. days on which at least one exceedance of the EU threshold value (180 µg/m³) for informing the population was measured in Belgium) can be found here.
Under special meteorological conditions an intrusion of ozone can happen from the free troposphere or even the stratosphere towards the lower atmosphere. This can exeptionally (last occurred in Belgium on the 5th, 6th and 7th of May 1995) cause exceedances of the threshold value. This may also be called 'spring ozone'. Also, powerful storms in spring or autumn, with great downwards air currents can lead to increased ozone concentrations at ground level.
-
I thought there was a hole in the ozone layer and thus too little ozone
The hole in the ozone layer is the annual re-occurring decrease of the thickness of the ozone layer above the South Pole in October-November (the Antarctic spring). As already postulated in the answer on the first question, an ozone layer exists in the stratosphere, at great height. This 'good' ozone protects us against the harmful solar UV radiation. Without this ozone, life would be impossible as a matter of fact. The 'bad' ozone in the lower atmosphere that we can thus inhale, can have detrimental effects (see here). The 'good' ozone in the ozone layer is chemically identical to the 'bad' ozone at ground level, yet the chemical reactions leading to formation of ozone in the ozone layer are different from those in the lower atmosphere.
Certain chemical compounds, such as CFC's (chlorofluorocarbons), bromine compounds, ... can disturb the reactions involved in ozone formation in the ozone layer, which will lead to a decreased concentration of ozone in the ozone layer (or in other words the ozone layer will grow thinner). Because of geographical and climatological reasons, this decrease is most spectacular above the South Pole.
Ozone-depleting substances were frequently used in the chemical industry, for example as coolant or as disinfectant in agriculture, and are very stable chemical compounds, allowing them to remain in the atmosphere for a long time. It can take up to 50 years before they reach the stratosphere and are eventually degraded; Most of these ozone-depleting compounds are forbidden by now, but because of their long lifespan it can still take many years before the ozone layer will regain its original thickness.
The ozone data published on this website are data about the lower atmosphere ('bad' ozone). Data on the stratospheric ('good') ozone cn be found on the KMI website.
-
Can't we use the exceedance of ozone at ground level to fill the hole in the ozone layer?
Ozone is a very unstable and reactive compound. For example, ozone can't be stored in bottles because it would immediately oxidate the walls of the bottle. As such, a first problem rises: how would you store it? In addition, during an period with ozone exceedances (ozone smog episode), ozone levels are not too high during the whole day. Ozone concentrations will increase during daytime, with a peak in the late afternoon, but will decline sharply by night (to almost 0).
When considering the total amount of ozone, the ozone in the lower atlmosphere is only a fraction of the amount in the ozone layer (less than 10%). Even if it would be technically possible (which is not the case), the transport of ozone to the ozone layer would be nothing but a drop in the ocean. The formation of ozone in the ozone layer is a process of formation and decomposition. On a daily basis, millions of tonnes of ozone are formed in the stratosphere (where the ozone layer is formed).
Preventing further thinning of the ozone layer can thus only be achieved by regulating the use of ozone-depleting compounds.
-
Which health effects are caused by high ozone values?
Because of its strong oxidising capacity, ozone can cause some health effects, depending on the concentration in the air, the exposure time, the sensitivity of the exposed persons and their level of activity. The table below shows an overview of the principal health effects resulting from brief exposure:
Exposure level Health effects mild response max 1 hour ozone concentration: 180-240 µg/m³
average decrease of lung functiona <5%, for sensitive persons <10%
incidental eye irritation (independent from physical effort)
incidental pulmonary symptoms such as coughing for sensitives
moderate response
max 1 hour ozone concentration: 240-360 µg/m³average decrease of lung functiona 5-15%, for sensitive persons 10-30%
irritation of eyes, nose and throat (independent from physical effort)
pulmonary symptoms such as coughing, pain in the chest, dyspnoea for sensitives
increasing severity and frequency of symptoms for persons with COPDb
severe response
max 1 hour ozone concentrations: >360 µg/m³average decrease of lung functiona >15%, for sensitive persons >30%
pulmonary symptoms such as persistent coughing, pain in the chest, dyspnoea
possible feelings of discomfort, shortness of breath, headache, nausea, dizziness for sensitives
strong increase of severity and frequency of symptoms for persons with COPDba Possibly paired with inflamation reactions, increase hyperactivity of pulmonary tract and change in lung clearing
b Chronic obstructive pulmonary diseaseOzone can evoke different health effects, among which changes in lung function; The other compounds present in the 'summer smog cocktail' cause stinging eyes, coughing and irritation of the mucous membranes. The appearance of these symptoms is dependent on different factors:
the ozone concentration: the higher the concentration, the more people will show symptoms and the more severe the complaints will be. It is however impossible to accurately tell which symptoms can be expected from which concentrations onwards.
the individual sensitivity: persons with pulmonary tract afflictions will notice an effect sooner than persons with a normal lung function. Children can also be expected to be more susceptible. In addition, there is a so-called group of 'responders' (about 10% of the population) who are more sensitive for smog episodes for reasons unknown.
the effort made: by making intensive effort outdoors, breathing will speed up and more air will pass through the lungs each second. In comparison with a resting person , this results in a greater exposure to ozone and thus a higher probability of effect.
The European treshold of 180 µg/m³ for informing the population may thus not be viewed as an effect treshold value under which absolutely no one will suffer any effect at all. However, the WHO (in 1990) postulated that the effects of concentrations lower than 200 µg/m³ will be limited in severity and will only prevail in less than 5% of the total population. Warning the whole population at lower concentration levels is thus not advised.
As such, it concerns a gliding scale and, while somewhat artificially, it is possible to talk about a mild response at (hourly mean) concentrations of 180-240 µg/m³, a moderate response at 240-360 µg/m³ and a severe response above 360 µg/m³.
It is possible to reduce the effects by taking some precautions. From the above, it is clear that the effect of ozone peak episodes can be avoided or limited by avoiding heavy physical outdoor activity at noon or during the early evening (12 am - 8pm). These precautions are to be taken by individual persons with sensitivity of the pulmonary tract and children, starting from concentrations of 180 µg/m³; From 240 µg/m³ onwards, the whole population should follow these guidelines. In case of occurring physical complaints, it is of course useful and advised to consult the family doctor, who is best acquainted with the personal health condition of the patient and thus best positioned to grant further personal advice. -
Which precautions can I take to protect myself from high ozone concentrations?
The highest ozone concentrations are measured during the afternoon or the early evening (12am-8pm). Because the inhaled volume of air (and thus also the amount of ozone) is up to 20 times larger during physical activity, it is advised to avoid outdoors physical activity (f.e. running) between 12am and 8pm. Because the ozone concentrations indoors are significantly lower (see here), it is advised for sensitive persons to stay indoors during an ozone smog episode.
-
Why are ozone concentrations higher in rural areas than in cities?
Ozone is a secondary pollutant, which means it is not directly emitted by traffic, industry,.. but it is formed on warm summer days by the influence of solar radiation on a cocktail of airborne pollutants. These ozone precursors are nitrogen oxides (NOx) and volatile organic compounds (VOC). Traffic is the main source (>50%) of ozone precursors.
It may sounds curious, but it is a fact that most of the times ozone levels are higher in rural areas than in cities. This is sometimes called the 'ozone paradox'. Ozone can be degraded by the compounds (NOx) by which it is also formed. This degradation occurs more often in cities than in rural areas, because there is more NO in cities (see further).
This does not mean there is less air pollution in cities (other pollutants are present, with higher concentrations than at the countryside), yet there is less ozone. As such, there is no linear connection between the amount of ozone precursors and the amount of ozone itself. A diminution of ozon precursors can even lead to an increase of ozone concentrations. This is what is observed during weekends: although less traffic is present, more ozone is observed (the formed ozone gets degraded less, because there is less pollution). In the scientific world, this is called the 'weekend effect'. The whole process of ozone formation clearly is a complicated story.
To explain why most of the time there is more ozone at the countryside than in cities, some explanation regarding the chemical base reaction concerning formation of ozone is needed. This reaction can be presented as follows (in a simplified manner):
NO2 + O2 (+ solar UV-light, + heat) --> NO + O3
In human language: nitrogen dioxide and oxygen react, which results in nitrogen monoxide and ozone. This reaction is speeded up in warmer conditions and with more UV-light.
This is an equilibrium reaction, which means the reaction also works in the other direction (whereby ozone gets degraded again): NO + O3 --> NO2 + O2.
In chemistry there is a law that describes an equilibrium will try to re-establish itself after a disruption. This is where VOC enter the scene: they react with NO, with formation of NO2 as a result. The NO concentration decreases (because it reacts with VOC). The equilibrium will try to repair this, thus the reaction will form more NO, according to the law mentioned above: the equilibrium is shifted to the side of NO. Trying to form more NO however also means an increase of ozone. In addition, more NO2 is formed, which can form even more ozone, leading to even higher ozone concentrations.
If you still remember that a lot of NO can be found in the exhaust gases from cars and NO has a very short lifespan (a couple of minutes) and is immediately converted (oxidised) into NO2, which has a longer lifespan of hours to even days, which in turn allows it to be transported over larger distances by wind, from the city to more rural areas, you will understand that there is less ozone in cities than at the countryside.
So summarizing:
- in cities, high levels of NO due to traffic reacting with ozone, forming NO2
- NO2-based ozone formation at the countryside (in warm and sunny conditions), but much less NO (because of less traffic) and thus less ozone degradation.
The above also explains why short-term measures (such as stopping traffic) can have an adverse effect on ozone pollution. Less traffic means less NO and thus less ozone degradation. Taking traffic measures at the moment of ozone peaks is rather useless. Such measures would have to be taken for several days (4-5 days) before the effect would be noticeable. Predicting ozone episodes in advance is however not easy. Making a good ozone forecast depends on correct weather predictions, which aren't always as accurate. Severely limiting traffic, with a chance of the weather not being warm and sunny 5 days later (and thus chance of ozone pollution), is far from evident.
Even then the chance of success is not guaranteed. A large part of the emissions responsible for ozone formation in Belgium is transported from abroad.According to a study from VITO, temporal measures during 3 summer months, with the aim to reduce the number of exceedances of the hourly ozone concentration above 240 µg/m³, will only decrease the ozone peak concentrations with only 5% at maximum.
Short term measures however have a sensitizing character (they make a car driver feel responsible for ozone pollution) and will improve the general air quality, but do not have a direct effect on ozone concentration.
Ozone forecast maps for today, tomorrow and the day after tomorrow can be found at our website under ozone forecasts.
The forecast for today has a chance of approximately 75% of being correct, those for tomorrow and the day after have a lower chance.
Complex computer models teach us ozone pollution can only decrease if:
1. emissions of ozone precursors are drastically reduced (by 60-70%)!
2. this happens not only in Belgium but the whole of Europe!
3. measures are not only taken during ozone smog episodes, but throughout the whole year!A whole series of measures have been taken at the European level and a lot more are in the pipelines, yet it will take a while (several years) before these measures will result in a decreased ozone pollution. An important measure in relation with this is thee European NEC directive from 2001, which dictates every EU country how many kilotons of NOx and VOC they are allowed to emit from 2010 onwards. This directive has already led to a sensible amelioration of the ozone problem. The number of ozone peak and the severity and duration thereof, is lower now in comparison with the 1990's, under similar meteorological conditions. At the moment, negotiations are taking place at the EU level, which will result in a new NEC directive with sharper emission limits by 2020, 2025 and 2030.
-
Can ozone also be found indoors?
As already mentioned, ozone is a very unstable and reactive compound. If it enters a room via outdoor air, it will react with all material that it touches. The ozone concentration will hereby approximately decrease by half. Because the highest ozone concentrations (outdoors) are measured between 12am and 10pm, it is best to ventilate rooms during ozone smog episodes before 12am or after 10pm.
In badly ventilated rooms where a lot of (old) copying machines and/or laser printers are active, drastically increased ozone concentrations can be observed. The last generation of laser printers and copiers are equipped with ozon filters, which break down ozone and limit the leftover emission to a minimum.
In the royal decree of the 11th of April 1995 (BS. 14/6/1995, blz 17055), a maximum exposure value of 200 µg/m³ in a working area is provided for ozone.
-
What can I do myself to prevent high ozone concentrations?
As already mentioned in the answer to another question, complex computer models tell us ozone pollution will only decrease when:
1. the emission of ozone precursors gets drastically decreased (by 60-70%)!
2. these measures are not only taken in Belgium but in the whole of Europe!
3. measures are not only taken during ozone peaks, but during the whole year!
Everyone can contribute to this by for example:
- making less trips by car and by using public transport more often.
- going by foot or by bike for short distances.
- keeping to the speed limits and avoiding 'sporty' driving (fast accelerations, high engine speeds).
- taking into account 'ecofriendliness' when purchasing a new car.
- using as little solvent-based paints as possible and instead using waterbased paints.
- using an economical heating system with high returns.
-
Is ozone only harmful for humans?
No, ozone pollution also has consequences for the environment and the economy. After short exposure to high ozone concentrations, some plants show visible leaf damage. In addition, ozone also has a cumulative harmful effect on crops, manifested as lessened growth and stress resistance. The affliction by ozone gets worse as the stomata open further by for example increased air or soil humidity. Exposure to high ozone concentrations will decrease the yield of grain, amongst others. During 'normal' summers, the potential yield loss of grain crops in Belgium is estimated at about 5%. In warm summers, this can increase up to almost 20%.
Because of its high reactivity, ozone also influences the surface of materials such as some plastics and paints, which might result in discolouration.
-
Are we on the right track, or is the ozone problem getting worse?
This question cannot be answered unambiguously and the answer will depend on the status indicator used, which means what parameter is used to observe the evolution of the status.
For the protection of public health, the daily maximum 8-hour mean is used as a parameter. As a long term goal it is decreed that this parameter may not exceed 120 µg/m³ on a single day. As a stepping stone, since 2010 this threshold may only be exceeded 25 days per calendar year, averaged over 3 years.
With the aid of this parameter, a 'peak indicator', called the AOT60ppb-max8h can be defined as the excesses above 120 µg/m³ of the daily 8-hour mean summed for every day in a year. As a 'mean indicator', the average value of all ozone concentrations measured during one year can be used (annual mean).
When considering the peak indicator, from analysis of the ozone measurements, it becomes clear (because of the decreasing emissions of precursors in Europe) that the size and number of ozone peak concentrations decreases since the mid 1990's (when looking at comparable summers).
However, if we consider the mean indicator (i.e. annual mean ozone concentrations), an unfavorable increasing trend can be observed, which points to increasing background concentrations. The fact that these background levels do increase, can on the one hand be explained by the global increase of ozone precursors in the northern hemisphere and on the other hand by a decreased ozone decomposition because of already imported local NOx-reductions, which leads to an increase of ozone levels, at least for our region.
-
What are PM₁₀ and PM₂.₅?
Besides gaseous pollutants, the atmosphere can also be polluted by particles. These particles (either in suspension, fluid or in solid state), have a divergent composition and size and are sometimes called aerosols. They are often catalogued as 'floating dust', but are best known as particulate matter (PM).
This floating dust is most often categorised based on their aerodynamic diameter. The aerodynamic diameter of a dust particle is the diameter of a sphere-shaped particle that shows the same behaviour in the atmosphere as a dust particle (which does not necessarily have a sphere shape). In the framework of air quality problems, particulate matter is the most important.
Particulate matter such as PM10, PM2.5, PM1 and PM0.1 is defined as the fraction of particles with an aerodynamic diameter smaller than respectively 10, 2.5, 1 and 0.1 µm (for your information: 1 µm = 1 millionth of a meter or 1 thousandth of a millimeter). In comparison, the average diameter of a human hair equals 50-70 µm (see figure below)

Bigger particles, after being emitted into the atmosphere, quickly get taken down by gravity or are washed out by rain. The finer particles can remain in the atmosphere for a longer time (a couple of days to weeks). As such, these finer particles can be transported over longer distances. Another consequence of this longer stay in the atmosphere is the possible alteration of composition and the change of characteristics of the particles because of physicochemical processes.

Source: C. Trimbacher Umweltbundesamt Wien
This picture is a electron microscopic image of particulate matter on a filter that was placed near a road. Black carbon (the little, grey balls) is ubiquitous on this filter. The light blue balls are particles originating from combustion processes; while the pink particles are minerals and the green cubes are salts.
-
Where does partiulate matter originate from?
Particulate matter consists of primary and secondary particles. The distinction between both is made based on their origin.
Primary particles are emitted directly into the atmosphere and can be solid or fluid.They can for example be mineral particles originating from soil erosion, desert sand, volcanic ashes etc. Also black carbon, originating from domestic heating or particles emitted by traffic, either directly from the exhaust or by wear of tyres or brakes, are included. Also particles that are resuspended by traffic (i.e. dust on the road which is blown up again ) belong in this primary fraction.
Secondary particles originate in the atmosphere, through chemical reaction of gaseous precursor compounds such as ammoniac (NH3), sulphur dioxide (SO2), nitrogen oxides (NOx) or organic compounds. From these gases or the reaction products thereof, aerosols can be formed through the formation of new particles (nucleation) or by adhesion to already existing particles (coagulation). From research carried out by VMM, it turns out the secondary anorganic fraction contributes for about 40% to the total mass of PM10 in Vlaanderen. This secondary anorganic fraction is formed out of NH3, SO2 and NOx.
-
What is particulate matter composed of?
The chemical composition of dust particles shows a high degree of variability and is dependent on the proximity of emission sources and on the transformations that the particles might be subject to in the atmosphere.
From the CHEMKAR PM101 study, it becomes clear the 'average' chemical composition of PM10 in Flanders consists of 40% secondary inorganic ions such as nitrate, sulphate and ammonium. This secondary inorganic particulate matter is mostly caused by emissions originating from the agricultural, industrial and transportation sectors. The organic mass (dioxins, alkanes, PAC's,...), which makes up 20% of the total mass of particulate matter, is a complex group that consists of both primary and secondary matter. It is assumed that combustion processes, amongst others, play an important role in the formation of this organic fraction.
The share of soil dust (14%) originates, as the name suggests, from whirled up soil dust. This might happen through for example plowing of fields, but it may also be street dust that is resuspended by traffic. It is mostly the coarser fraction of PM10 we are talking about here.
Sea salt (8%) emerges from the evaporation of flown up droplets of sea water and has a composition similar to sea water. Elementary carbon (4%) is a measure for soot released by fossil fuel and biomass burning. Presumably the most important source of this component is (diesel-based) road traffic. There are multiple clues that this fraction of particulate matter is one of the most harmful for human health.

1Source: Chemkar VMM (2009), Chemkar PM10: Chemische karakterisatie van fijn stof in Vlaanderen, 2006-2007.
-
What are the causes of particulate matter?
Particulate matter particles can either originate from antropogenic (caused by humans) or from natural sources. Volcanic eruptions, soil erosion, sea salt or the import of desert sand are all examples of possible sources of particulate matter. Also pollen (from vegetal origin) can be a component of particulate matter.
A distinction needs to be made between the emissions and the atmospheric concentrations (also called immissions) of particulate matter. With emissions (expressed as f.e. tons per year), solely the emission of particulate matter by sources (traffic, agriculture, industry) is meant. The concentrations (most often expressed as micrograms per cubic meter) in open air are determined by those emissions and the meteorological conditions. There is, however, no linear relation between the emissions and the concentrations of particulate matter.
The primary and secondary emissions in Europe (EU27), Belgium, Flanders, Brussels and Wallonia are shown in the numbers below. The secondary emissions are expressed as an Aerosol Formation Potential (AFP), which takes into account the extent to which gaseous emissions of the precursors NOx, SO2 and NH3 contribute to the formation of secondary particulate matter (De Leeuw, 2002).
The most important antropogenic primary emissions of PM10 in Europe (EU27) of 2008 were the emissions of combustion processes in commercial, institutional and domestic energy use (35%), industrial processes (17%), road transport (14%) and agriculture (12%). These are also the most important sectors for Belgium, although industrial processes (30%) and road transport (21%) do carry some more weight. The most important antropogenic secondary emossions of PM10 in Europe are energy production and distribution (26%), road transport (25%), agriculture (17%) and industrial energy use. In Belgium, we see road transport (32%) representing an important share of these secondary emissions. The proportions of emissions per sector can vary depending on the region considered, the activities taking place, the population density, the amount of traffic, etc.
-
Which concentrations may not be exceeded?
The 2008 European directive on air quality sets limit values for some pollutants. They are science-based concentration levels that must not be exceeded in order to reduce harmful effects on human health and/or the environment as a whole.
The limit values are maximum concentrations expressed in µg/m³ for different time periods: hourly, daily or annual average concentration. There are levels for sulphur dioxide, nitrogen dioxide, PM₁₀, PM₂.₅, lead, benzene and carbon monoxide.Pollutant
Averaging period
Limit value
Date by which limit value is to be met
PM₁₀
Annual average
40 µg/m³
Since 1 January 2005
Daily average
50 µg/m³
Since 1 January 2005
PM₂.₅
Annual average
25 µg/m³
Since 1 January 2015
Benzeen
Annual average 5 µg/m³
Since 1 January 2010
CO
Maximum daily eight hour mean
10 µg/m³ Since 1 January 2005
Lood
Annual average
0,5 µg/m³ Since 1 January 2005
NO₂
Annual average 40 µg/m³
Since 1 January 2010
Hourly average 200 µg/m³
Since 1 January 2010
SO₂
Daily average
125 µg/m³
Since 1 January 2005
Hourly average 350 µg/m³ Since 1 January 2005
In addition to these limit values, which are mandatory to attain, the directive also describes target values, information thresholds and alert thresholds for various pollutants. Target values are concentrations to be attained where possible, while information and alert thresholds are concentration levels at which Belgium is obliged to inform the public.
Every year, we test the entire Belgian territory against these limit values in our annual air quality report. -
What are the guidelines drafted by the World Health Organisation?
The World Health Organisation (WHO) has drafted guidelines for certain pollutants with the aim to reduce the health effect as much as possible. These guidelines are meant to inform policy makers across the globe and to reduce or prevent the risks of air pollution in an effective manner. The guidelines are established after evaluation of scientific studies (meta-analyses). The guidelines were revised in September 2021:
WHO guidelines Pollutant Subject Averaging Period Old guideline value (2005) New guideline value (2021) Particulate Matter - PM10 guideline value 1 day
1 year50 µg/m³ (max. 3 - 4/year)
20 µg/m³45 µg/m³ (max. 3 - 4 exceedances/year)
15 µg/m³Particulate Matter - PM2.5 guideline value 1 day
1 year25 µg/m³ (max. 3 - 4/year)
10 µg/m³15 µg/m³ (max. 3 - 4exceedances/yearr)
5 µg/m³Nitrogen dioxide (NO2) guideline value 1 hour
1 day
1 year200 µg/m³
/
40 µg/m³200 µg/m³
25 µg/m³
10 µg/m³Suphur dioxide (SO2) guideline value 10 minutes
1 day500 µg/m³
20 µg/m³500 µg/m³
40 µg/m³Ozone (O3) guideline value 8-hour*
6 month/8-hour**100 µg/m³
/100 µg/m³ (max. 3 - 4 exceedances/year)
60 µg/m³Carbon monoxide (CO) guideline value 15 minutes
1-hour mean
8-hour mean
1 day100 mg/m³
35 mg/m³
10 mg/m³
/100 mg/m³
35 mg/m³
10 mg/m³
4 mg/m³ (max. 3 - 4 exceedances/year)Benzene reference value calendar year 1.7 µg/m³ 1.7 µg/m³ Lead (Pb) guideline value calendar year 0.5 µg/m³ 0.5 µg/m³ Arsenic (As) reference value calendar year 6.6 ng/m³ 6.6 ng/m³ Cadmium (Cd) guideline value calendar year 5 ng/m³ 5 ng/m³ Nickle (Ni) reference value calendar year 25 ng/m³ 25 ng/m³ Benzo(a)pyrene (B(a)P) reference value calendar year 0.12 ng/m³ 0.12 ng/m³ Until today, the scientific world has not been able to establish a value beneath which no health effects prevail. The guidelines shown above can thus not guarantee absolute protection of health. The WHO guidelines are meant to be used all over the world to support actions (in various contexts) for amelioration of air quality.
The limit and target values used in the European Union are most often a consideration of three elements: protection of public health, the accompagnying risk analysis, and the political context. The standards are dependent of the used strategy to reach a balance between health risks, technical feasability, economical considerations and even more political and social aspects, which in turn are dependent on the level of development and the options of a member state, and the available expertise on air quality.
-
Health effects of particulate matter: is there a decreased life expectancy?
The finer a particle is, the deeper it can penetrate the human body via the pulmonary tract. The finest particles can even reach the cardiovascular system. PM10 can disturb the mucous secretionl in the respiration system, cause breathing problems and increase the susceptibility to infections of the respiratory tract.The presence of polycyclic armoatic carbohydrates (PAC) in some dust particles does, amongst others, promote the development of lung cancer. Other toxic substance found in particulate matter can, after deposition in the lungs, spread further in the (human) body via the vascular and/or lymphatic system. The risk of experiencing a heart attack also increases by exposure to high peak concentrations of particulate matter. Ultrafine particles (UFP or PM0.1) penetrate further into the lungs than larger particles, have a larger surface area per volume and can reach the vascular system directly. There is a still increasing amount of clues that UFP (mainly the particles originating from exhausts of traffic-related combustion processes) can cause health problems. It is however still unclear which mechanisms are behind these health effect.
The World Health Organisation (WHO) postulates that short exposure to high concentrations of particulate matter (short term exposure) may have following effects: inflammation of lung tissue, effects on the respiratory tract, detrimental effects on the cardiovascular system, an increase in the use of medication, hospitalisation and mortality. People with respiratory diseases, such as asthma, chronic obstructive pulmonary disease (COPD), heart problems, but also elderly people and children are considered risk groups.
Also long term exposure to lower concentrations of particulate matter may cause negative health effects (long term effects). The WHO poses there is an increased risk for respiratory diseases and decreased life expectancy as a consequence of cardiopulmonary (heart and lungs) mortality and probably also as a consequence of lung cancer. These effects are more pronounced in elderly people, children or persons with heart, immunity or respiratory afflictions.
Framed in the CAFE programme (Clean Air For Europe), it was calculated that in the year 2000, the life expectancy in the EU decreased with 8 months on average due to PM2.5 exposure. For Flanders, the loss of life expectancy due to chronic health effects of PM2.5 was even larger, with a decrease of 1 healthy year. In Scandinavia, the decrease in life expectancy is the smallest.
From an American study, it appears life expectancy increases again when concentrations of particulate matter decrease.

Figure: The number of months of life expectancy decrease caused by PM2.5 in 2010. This estimation was based on model results, not measurements! -
Does a mouth mask help to decrease inhalation of particulate matter?
A simple paper mask does absolutely not protect suffieciently against fine particles.
Protection masks that have to be used by labourers exposed to particulate matter do exist though. These masks consist of filtering and absorbing materials that meet the demands as described in European Directive 89/686/EEC, regarding personal protective equipment.
However, it would be excessive to wear such masks on the street (be it in our country). Only people suffering from certain diseases or laborers that are continually exposed to concentrations of particulate matter may benefit from wearing such masks.
-
Are the European PM₁₀ thresholds respected in Belgium?
Because it is impossible to place a measuring station everywhere in Belgium, interpolation maps are used to spatially represent concentration across Belgium. These maps (with a 4 by 4 km² resolution) are made with the RIO-Corine interpolation technique. This technique uses satellite land use data to estimate the PM10 pollution in areas where no measurements occur.
Annual mean PM10 concentrations
The European annual limit value (40 g/m³) was not exceeded in 2015 (see map). In previous years, slight, local exceedances were sometimes observed near important emission sources. In 2003, the annual limit was surpassed in several locations because of the extreme meteorological conditions in that year (dry, low mean wind speeds and above average continental air currents). The annual mean PM10 concentration can be considered a measure for long term exposure, To get an historical overview of the annual mean PM10 concentrations, click here.
Daily mean PM10 concentrations
The European PM10 daily limit value ( a maximum of 35 days with a daily mean concentration exceeding 50 µg/m³) was not exceeded in 2015 in Belgium. To get an historical overview of the annual mean PM10 concentrations, click here.
-
What share of particulate matter in Belgium originates from abroad?
According to multiple studies and simulations, 70 to 80% of the measured concentrations is always present, even in absence of emissions in Belgium. This proves that a large part of PM10 pollution can probably be alocated to long distance transportation. Besides this share (transboundary background) there are other regional and local contributions. In zones with high emissions of particulate matter (agglomerations, industrial zones,...) the impact of local emissions on measured concentrations is much more important.
From another point of view, it is noticeable that emissions originating from abroad will have a large impact on the annual mean concentrations, whereas daily exceedances of the treshold will be mostly related to local emissions.

Vice versa, it can also be stated that a lot of 'Belgian' particulate matter is being exported abroad; a statement that is supported by the figure below. This figure shows the decrease in PM2.5 concentrations throughout Flanders and the neigbouring countries, in case Flemish emissions would be completely absent.

-
Is domestic heating an emission source of particulate matter?
Heating systems can use different energy sources: fossil fuels (coal, oil fuel, gas), biomass (wood,...) or natural sources (solar energy, geothermics,...). Only the systems using natural resources are emission neutral. Despite the fact complete combustion only leaves carbon dioxide and water emissions, most combustions are incomplete, thus also leaving polluting gases and particles. Most fuels also contain impurities or non-combustable elements, in variable amounts. As such, polluting emissions are dependent on the type of fuel and the technology used.
During the last years, wood-based heating systems are being used more and more once again. Wood is often considered a clean, renewable and cheap energy source, because of which we would not have to use fossil fuels anymore. However, wood remains a 'raw' energy source, consisting of unrefined, complex elements. To ensure the emissions being kept very low, we should be able to perfectly control the burning process.
Recent European studies have shown that biomass burning (burning of wood or vegetation) adds to air pollution to a large degree, mostly in winter. The European CARBOSOL project has studied the contribution of different energy sources on the fraction of organic carbon. The analysis methods used in the research used chemical tracers, such as levoglucosan, and also used C14 measurements. Levoglucosan - a sugar formed by burning cellulose - appears to be a good chemical tracer, allowing to unambiguously determine the emissions arising from biomass burning. C14 is a radio-active isotope of carbon that desintegrates too quickly (half-life of ca. 5730 years) to be found in fossil fuels, but that is present in biomass. The results have shown that 50-70% of the mass of carbonaceous aerosols originates from biomass burning, independent of geographical location in Europe.
To limit the pollution, and mainly the carbonaceous part, on a continental scale in winter, technological developments regarding biomass burning are required as well as rigorous reglementations to limit the possible applications.
-
Are dust filters for cars an efficient way of reducing particulate matter pollution?
In order to meet the emission norms for particulate matters (Directive 98/70/EC, EURO4), car constructers have equipped their vehicles with dust filters. The filter eliminates a large part of the particles in exhaust gases of diesel cars, by means of a physical filtration on a ceramic substrate.
To guarantee the efficiency of the filtration and to avoid obstruction and loss of engine performance, it is necessary that the filter is regenerated during approximately 10% of the driving time. During this regeneration phase, the temperature in the filter has to be approximately 500°C, so it is possible to burn and destroy the accumulated particles. This temperature is much higher than the normal temperatures of exhaust gases, which is about 200°C. The solution is to raise the temperature ahead of the filter, by injecting an amount of fuel into the catalyst, where it will be ignited. In some filters, the addition of a catalyst additive to the fuel will allow a decrease of the regeneration temperature.
In absence of an additive, the regeneration is less effective, certainly under urban traffic conditions. In real driving conditions, the regeneration phase implies an increased emission of polluting gases (NO2). In the test cycles for emission levels (EURO norms) as of today, this is not taken into account. Additionally, the effectiveness of the filters decreases with the size of the particles. Even if only 1 to 5% of the total mass of particles escapes the filter, this number is very important, seeing as these particles often have a diameter below 1 µm and thus belong to the fraction having the largest impact on health.
-
Are diesel cars the only polluters?
If we compare diesel cars with gasoline cars, it it true gasoline cars with direct injection (DI) emit greater numbers of ultrafine particles (UFP) than diesel cars with a soot filter. Until September 2017, the EURO6-emission norm for UFP for DIgasoline cars will be 10 times higher than that for diesel cars (6 x 10^12 against 6 x 10^11 particles/km). To remain below the threshold of 6 x 10^11 UFP particles, DI gasoline cars will have to be equipped with a gasoline particulate filter (GPF). In 2014, the automotive sector convinced the European legislators to delay this norm with 3 years, in order to allow for DI gasoline engines to be technically adapted so they could pass the stricter norm by September 2017, without needing the GPF. Whether passing this UFP norm without GPF, even under realistic driving conditions, is doubtful however. Until this norm is attained, we can thus state direct injection gasoline cars are another important source of UFP, as they emit more particles than diesel cars equipped with a soot filter. The figure below, which shows these emissions for the different types of cars, clearly illustrates this.
As such, diesel cars are not the only source of air pollution, also all other types of cars with a combustion engine (CNG,..) emit pollutants. Even electric cars are not 'zero emission' vehicles: they equally cause particulate matter pollution via non-exhaust emissions such as wear of tyres, road surfaces and brakes. In addition, the durability of the electricity required to charge their batteries has to be taken in consideration.
DPF: diesel with filter, GDI: direct injection gasoline, non-DPF: diesel without filter
Source figure: https://www.aecc.eu/wp-content/uploads/2020/08/151027-IQPC-RDE-AECC-RDE-of-a-GPF-equipped-production-car_final.pdf, slide 3
-
When do smog episodes arise?
Smog is a contraction of the words 'smoke' and 'fog'. The word was first used in the 1950's, when on some winter days a fog of smoke hung over London. This smog was caused by the frequent use of (polluting) coal for domestic heating. The word smog is now used to indicate a period with too much air pollution. During summer, this is altered to 'ozone smog' or 'summer smog'. In winter periods, the main component of '(winter) smog' is particulate matter. Also in spring time (March/April), smog episodes can take place, mainly caused by particulate matter originating from an increase in inorganic, secondary particulate matter.
Smog episodes during winter (December-February) are mainly caused by limited dilution of air pollution, under unfavourable meteorlogical conditions: little wind (from continental directions) and a temperature inversion. Little wind results in very little horizontal dispersion (spread) of the pollution, while temperature inversions hinder vertical dispersion. When wind has an eastern component, polluted air from Eastern Europe is imported. This continental air is most often more polluted than Atlantic (maritime) air and can be transported over very large distances. Particulate matter from Eastern Europe can reach our country that way, leading to a significant increase of particulate matter concentrations.
Thermal or temperature inversion
Under normal circumstances temperature decreases as height increases. In case of a thermal or temperature inversion, the opposite is true: from a certain height temperature increases again and becomes higher than the temperature in lower layers. The air pollution, which is normally dilluted vertically, is now contained by this temperature inversion. The inversion layer acts as a kind of blanket that blocks air pollution. Thermal inversion often occurs during winter, when we are under the influence of a high pressure system, in which downward air currents are present. Descendig air heats up, which in physics is called adiabatic compression. If this is the case, we can speak of a subsidence-inversion.
If there also is little wind during a period of temperature inversion, the horizontal distribution of air pollution also gets tougher. The polluting compounds will accumulate in a smaller volume of air (because of the inversion), which will lead to an increase of, amongst others, particulate matter. The lower in the atmosphere the inversion begins, the smaller the volume in which the pollution can accumulate will be and thus the more unfavourable the inversion is for the air quality.

A temperature inversion can be visible sometimes: on the 18th of February 2008, a domestic fire occurred in Waregem (Flanders). Because there was no wind that day, the smoke plume rose vertically. Because there also was a temperature inversion, the smoke rose up to that level, after which it spread out horizontally. Photo by Frank Desoppere
-
What measures against smog episodes are taken in Belgium?
The European Commission obliges member states to create action plans in order to limit the risk of exceedances of the target and limit values and the duration of said exceedances. These plans might consist of controle measures and, if necessary, prohibition of certain activities that contribute to the exceedance of the limit values (road traffic included). Member states can take into consideration more specific measures to protect the most vulnerable population groups, for example children.
On 2 September 2008 the ministers of Environment of the three regions, together with the Interregional Cell for the Environment (IRCEL) have adopted the protocol that determines the coordination during pollution episodes. The protocol is activated in occurence of pollution peaks of PM10 or NO2. Based on the partnership agreement between the Brussels, Flemish and Walloon Regions regarding the supervision of airborne emissions and of the restructuring of the data (Belgisch Staatsblad 24-06-1994, p 17211), the task of IRCEL is "to monitor phases of increasing pollution and to warn the agencies responsible appointed by the Regions". More specifically, IRCEL distributes an information bulletin in case increased concentrations of PM10 and/or NO2 are forecasted of measured. These tasks are being executed since December 2003 on demand of the Brussels Capital Region, since January 2005 on demand of the Flemish Region and since December 2005 as requested by the Walloon Region.
To predict episodes of increased concentrations, IRCEL uses forecasts derived from meteorological models (ALADIN, ECMWF) to identify dispersion conditions. In addition, forecast originating from models run at IRCEL itself are used to predict concentrations (a.o. SMOGSTOP, OVL and CHIMERE). These different information sources are analysed, compared and confronted with earlier experiences within the field of air quality forecasts.
Activation of the protocol
The activation of the protocol happens in two phases: a pre-alarm phase, followed by an alarm phase.
1. Pre-alarm phase
This phase will be initiated to prepare certain services of the Regions in a state of readiness and starts if forecasts point towards exceedances of the regional threshold values of 70 µg/m³ (daily mean) for at least two subsequent days for PM10. For NO2, one of the most important pollutants within the traffic sector and is specifically part of the Brussels' plan of action, a first threshold is set at 150 µg/m³.
The threshold of 70 µg/m³ is used in all three Regions, only the geographical interpretation differs:
Brussels: the daily mean concentration of 70 µg/m³ has to be reached in at least two measuring stations in Brussels
Wallonia: the concentration of 70 µg/m³ has to be reached on average in two geographical zones in Wallonia, in the north and the south.
Flanders: the daily mean concentration of 70 µg/m³ has to be reached across the whole Flemish Region
2. Alarm phase
The alarm phase is activated one day before an episode with increased pollution. This phase only takes place if the forecasts at IRCEL confirm the risk of increased pollution that was previously predicted during the pre-alarm phase.
The activation of the alarm phase implies IRCEL spreading an inforation bulletin containing following data:
The causes of the episode of increased pollution
The current situation and the expected evolution
The nature of the pollutants
General recommendations for public health and actions to be taken to limit the emissions.
Elongation and end of a smog episode
A smog episode predicted by IRCEL always lasts at least two days. In case of a smog episode lasting longer than two days, IRCEL communicates an internal message on the suspected evolution of the situation, starting on the second day. If necessary, a message can be sent to the press. Based on analyses and interpretations of measured and predicted values, IRCEL communicates about the end date of the smog episode and does so one day before this end. This message is also integrally communicated to the media.
Activation of regional action plans
When the alarm phase is in effect, each Region has to activate the measures as foreseen by the emergency plans for peak concentrations of particulate matter.
For more information on the regional plans, we refer to the sites below:
Brussels Capital Region:
Walloon Region:
Flemish Region:
In addition to the threshold value of 70 µg/m³, the plans in Brussels and Wallonia provide two additional intervention thresholds (100 and 200 µg/m³) with additional measures. For NO2, two additional threshold values are set at 200 and 400 µg/m³.
-
What can the population do in occurrance of peak concentrations of PM?
In case of high concentrations of particulate matter, persons vulnerable to this pollution should keep in mind following precautions:
Stay indoors, do not ventilate, keep doors and windows closed
Do not smoke and/or do not enter a smoking area
Do not exert any sustained physical effort (f.e. running)
Persons already suffering heart or lung diseases, are advised to consult their personal doctor to make an assessment of the need to adjust their treatment. These persons should consult their personal doctor at the slightest change of symptoms. Other vulnerable persons showing breathing or cardial difficulties, should also consult their doctor immediately.
-
What can I do myself to reduce PM emission?
By means of a few small and simple behavioural changes, everyone can contribute to a reduction of particulate matter emissions, certainly when smog episodes occur:
- Using alternative ways of transportation, such as public transport or by bike, instead of using your own car
- Carpooling
- Not using diesel cars that aren't equipped with soot filters
- Not using a fireplace or a stove 'for fun'
- Lowering the heating system a degree ot two
-
Is driving 90 km/h a drop in the ocean?
The effects of a speed reduction to 90 km/h during smog episodes in Flanders have been studied using a modelling apporach. This 90 km/h measure (SMOG90-measure) is applied on parts of the highway that pass through rather densely crowded areas (see figure 1 and 2 below). Through a coupling of several air quality models, the situation with and without the measure was simulated. Afterwards, the effect of the measure could be indicated by the difference between concentrations in both situations.
From this study, it is clear speed reductions during smog episodes do have a significant impact on air quality. The reduction of the PM10 and PM2.5 concentrations are limited to a couple of percents (see figures below) and are located in the immediate vicinity of the highways. For elementary carbon (EC) however, a significant reduction of 30% can be observed near these same highways, which is important. Elementary carbon is a measure for diesel soot, and an increasing amount of studies show that combustion-related particles, mainly originating from traffic exhausts, cause health effects (see figures 3, 4 and 5 below).
Another result of a speed reduction to 90 km/h is that it may lead to a decrease in elementary carbon of 5 to 10% in some locations up to 4 km away from the highway. Additionally, it was calculated that over 40 000 Flemish are being exposed to at least 10% less elementary carbon or diesel soot as a result of the speed limit. This decrease is even greater than 15% for over 7500 Flemish people. It is also striking that almost 1 million Flemish (1/6th of the population) live less than 1500 meters away from the highways and ringroads on which the speed reduction is introduced.

Figure 1: Road segments in Flanders on which the SMOG90-measure is applied.

Figure 2: Road segments in Wallonia on which the SMOG90-measure is applied.

Figure 3: Influence of the SMOG90-measure on PM10.

Figure 4: Influence of the SMOG90-measure on PM2.5.

Figure 5: Influence of the SMOG90-measure on EC.
-
What is the influence of climate on particulate matter?
The influence of climate change on particulate matter concentrations was investigated by means of air quality modelling simulations. For the calculations of the future PM10 concentrations (2030) several emission scenarios were used in addition to the meteorological data of the year 2003. The use of the extreme year 2003 (dry, hot summer, temperature inversions during winter) serves as a proxy for the weather type that will occur more frequently according to the current climate projections and should provide an impression of the effect of climate change. In these simulations, both scenarios of reduced emission (reference, Europe and visionary scenarios) and climate change are taken into account.
The reference scenario takes into account the legislation and regulations currently in effect, while the Europe scenario also considers a number of additional measures as described in the European strategy regarding air quality. The visionary scenario concerns profound measures for the improvement of air quality. The concentrations are calculated using the Beleuros model, taking into account these scenarios.
Using the extreme weather conditions of 2003 has a considerable effect on the annual mean PM10 values in Flanders. When compared with a similar scenario, but using the meteorological data of 2007, which is regarded as a normal year for particulate matter, differences of the order of magnitude of 5 µg/m³ can be observed. The European annual treshold value (40 µg/m³), however, is not exceeded in any scenario, even with extreme meteo. A graphical representation can be found in the form of figure 1.
The use of the extreme weather conditions also has a significant effect on the number of exceedances of the European daily limit value for PM10. The percentage of the population in Flanders that is exposed to daily mean concentrations above 50 µg/m³ on more than 35 days, is about twice as high using the extreme meteo in comparison with the normal values in case of the reference scenario (figure 2). In the Europe scenario, the difference is even greater, with a factor 4.5. In spite of the reduced emissions that are already part of the reference scenario, climate change will lead to a larger proportion of the population being exposed to exceedances of the daily PM10 limit in 2030 than was the case in 2007. This leads to the conclusion that climate change can nullify the reduction of emission of the reference scenario. Or in other words, climate change will nullify the efforts of emisson reduction as set out in current environmental policy.

Figure 1:Forecasted annual mean PM10 concentrations using different scenarios and meteorological data.
Figure 2:Forecasted population exposure to PM10 concentrations above 50 µg/m³ during more than 35 days per year, using different scenarios and meteorological data. -
What is the influence of particulate matter on the climate?
In general, it can be said there is a coherence between climate change and air quality, albeit a complex one. As such, a great deal of additional scientific research is required in order to understand this coherence. Certain pollutants, among which elementary carbon (but also ozone) induce a temperature rise through heat adsorption, whereas others, such as SO2 (reflecting properties) lead to climate cooling. Some studies state elementary carbon would be the second or third most important pollutant in terms of global warming. Elementary carbon is a fraction of particulate matter and originates mainly from incomplete burning processes. Black carbon is also considered a measure for diesel soot (diesel engines are the main source of black carbon in Europe). Measures to reduce these emissions might show results for the climate on the short term, seeing as diesel soot is a (controlable) source of particulate matter.
-
Why are the target values of the WHO stricter than the European limits?
When defining the European limit values the baseline was the following question: 'Which limit values can we impose on the EU-27 to achieve the best possible air quality, which provides maximal protection for the population, in a cost-efficient way?' An extensive cost-benefit analysis was made to address this question. Such an analysis compares the economical costs needed to reduce air pollutant emissions (e.g. installation of soot filters) to the benefits resulting from these measures (e.g. decrease in health insurance expenses by decreased prevalence of asthma). Based on this analysis, the costs and benefits are politically balanced, ultimately leading to feasible limit values. Cost-benefit analyses like this are subject of discussion, as the benefits (e.g. health gains) are expressed in monetary terms, which is not always easy, and the costs to decrease emissions are often underestimated, according to industry. Besides, the EU states the costs may not be out of proportion, because extremely high costs could unhinge the social-economic situation, even though the benefits would still be greater than the extreme costs.
-
Is going for a run in the city dangerous?
While sporting, a person inhales a larger quantity of air and thus also more air pollution. Yet, the answer to whether sporting in the city is a good idea, is more complicated than this. Multiple studies show that the health benefits of excercising (sporting) are larger than the disadvantages caused by air pollution. When you excercise in the city, try to avoid busy thoroughfares, but go for a jog in park areas or the roads with less (car) traffic. During smog episodes, (intesive) excercising in open air is not recommended.
-
What is the danger of NO₂? How can it make you sick?
NO2 or nitrogen dioxide is a compound released during combustion processes. Air composes of approximately 80% nitrogen (N2), which is oxidised to nitrogen monoxide (NO) and partially to NO2 by reactions with oxygen (O2) at high temperatures. NO is further oxidised to NO2, which is a strong oxidant, in the atmosphere. NO2 can cause irritation of eyes, nose and throat and when inhaled might cause lung irritations and decreased lung function. In areas with higher levels of nitrogen dioxide, a greater chance of asthma attacks and an increase in hospital stays because of respiratory complaints are observed. It was thought for a long time that NO2 was an indicator for the complex mixture of traffic-related air pollution rather than being harmful itself. A good correlation exists between NO2 and other compounds, such as diesel soot, which makes it difficult to tell which of the two is (the most) harmful. Recent studies however indicate that nitrogen dioxide is more than a proxy for air pollution, but that is harmful as a seperate molecule as well.
-
Who is most susceptible to urban air pollution: pedestrian, cyclist, car driver or bus passenger? Why?
Research of the university of Hasselt, where a group of people carried a personal black carbon measuring device during all their movements for a week, pointed out that when traveling, people are exposed to 2 to 5 times the air pollution in comparison to when staying at home. The highest concentrations were measured for car drivers and passengers of both cars and busses. The concentrations to which people were exposed when moving on foot or by bike were about 50% lower. The lowest concentrations were observed in trains. Of course, a lot depends on the trajectory chosen for the relocation. The eventual amount of pollution inhaled is also dependent on your respiratory rate and the time spent relocating. If you calculate the dose inhaled (or pollution per minute), it appears the more active persons (pedestrians and cyclists) inhale a dose about twice as high as the more passive ones (moving by car or bus). This is caused by the higher breathing frequency of cyclists and pedestrians. When moving on foot or by bike, it is advised to do so along streets with as little traffic as possible.
Source: article university of Hasselt
-
Which is better for car ventilation: external air or internal recirculation?
This depends on the circumstances: when in a traffic jam in a tunnel, it is better to let the air circulate internally. In tunnels in Brussels, NO2 concentrations can be more than 10 times that in the Brussels open air. However, when you leave the tunnel or the traffic jam dissolves, don't forget to turn on the external ventilation again. By switching on the internal ventilation for a prolonged time, the air quality inside the car will decrease also.
-
What is the role of greenery in the city? Would Brussels be off worse without the Sonian forest?
Greenery in the city does have a lot of advantages: it has a positive impact on air quality, trees can, through their leaves, filter particulate matter out of the air, and it does decrease the heat island effect. On the other hand, trees in narrow streets with a lot of traffic can, in certain configurations, result in the pollution being spread out worse and thus remaining beneath the foliage. The trees are however NOT the cause of that pollution; that role is reserved for road traffic most certainly. The impact of the Sonian forest on air quality is not so easily calculated. In case there would be no Sonian forest, but the same location would be filled with houses, traffic and/or industry, the resulting air pollution would have a negative effect on air pollution in Brussels in case of southeast winds. In addition, the Sonian forest does filter out part of the regional share of particulate matter entering Brussels in case of southeastern winds. This positive influence, however difficult to estimate, would also disappear together with the Sonian forest.
-
Do urban inhabitants suffer an increased risk of diseases related to air pollution ?
In general, air pollution levels observed in cities are higher than those on the countryside. The pollutant having the largest long term impact on health is PM2.5. This is particulate matter with a diameter smaller than 2.5 µm. In Belgium, the chronical or long term exposure to PM2.5 results in an average decrease in life span of 7 to 9 months. In the larger agglomerations (such as Brussels) the PM2.5 concentrations are above average, thus the decrease in life span will also be (a couple of months) greater there.
-
Do motorcyclists inhale much more air pollution in tunnels than car drivers?
On the one hand, motorcycle riders don't have a button for internal air circulation, but on the other hand a motorcyclists won't be hindered (as much) by traffic jams. So, in case there is no traffic jam and the motorcyclist would take as much time passing though the tunnel as a car driver, the answer would probably be yes. In case of a traffic jam and in a car without internal ventilation, the car driver will presumably be exposed more. When comparing with a car driver in a traffic jam in a car with internal ventilation, it will probably depend on the time spent in the traffic jam.
-
When is a face mask useful?
Simple and cheap face masks do stop a large fraction of 'coarse' dust, but not the finer particulate matter, such as PM10 and PM2.5, and most certainly not the ultra fine particles (UFP). UFP or PM0.1 is particulate matter with a diameter smaller than 0.1 µm, which is still significantly smaller than PM2.5 or PM10.
The more expensive FFP2 masks do stop more particulate matter, but surely not (all) UFP's. Experiments with the better masks showed that the blood pressure of test persons walking in Beijings' smog wearing a mask was a bit lower on average, than when walking without a mask. These measurements of blood pressure are indicative of lessened hindrance of air pollution. However, it has to be noted that this study was not a double blind experiment. To further study the effect of facemasks against air pollution, a double blind experiment should be performed as well, which however isn't evident. This kind of experiment would be required because the persons wearing face masks might also have a lower blood pressure because they are 'comforted' simply by wearing the mask (without taking into account the actual effect of reducing air pollution exposure).
-
How is air pollution in Brussels, in comparison with other European cities?
In large agglomerations like Paris, Berlin or Milan, the yearly limit value for NO2 is still being exceeded on locations with a lot of traffic, just as in Brussels. The highest concentrations of particulate matter are measured in East-European countries, because coal still is a major source for heating and power generation there.
On a map of the concentrations of nitrogen dioxide throughout Europe, Brussels and Antwerp are clearly recognisable as red dots, just like Paris, London and Amsterdam and the cities in North-Italy.

In Denmark, a car costs about twice as much as here, after VAT and taxes. Stockholm is another good example: it has sort of a road toll that had significantly (and permanently) reduced the severity of traffic jams. In Berlin and other German cities, low emission zones have been introduced for years, which prohibits the most polluting cars from entering the inner city. Such a low-emission zone will be installed in Antwerp in 2017
More information can be found in the annual report on air quality of the European Environment Agency.
For EU maps of measurements, see map with data of 2013
-
How harmful is particulate matter and what are the health effects?
Diesel soot is being regarded as carcinogenic by the WHO since 2012. Exposure to too much diesel soot (which is one specific component of particulate matter) increases the risk of lung cancer. Exposure to particulate matter in general does not only lead to an increased risk of lung cancer, but also of cardiovascular diseases.
The last years, epidemiological research has proven that there are also other, less expected health effects: lower birth weight in children of which the mother lives in an area with increased air pollution, air pollution leads to a higher chance of arteriosclerosis, diabetic people are more sensitive to the effects of air pollution etc.
It is however useful to compare these risks to other health risks. A study carried out in the US in 2002 showed that the loss of life span due to air pollution is comparable to the effects of slight to severe overweight (BMI between 25-27 or 30-40 respectively).
Because the present exposure to particulate matter, the life expectancy in Belgium decreased with 7 to 9 months on average. As a comparison, smoking results in an average life span decrease of 10 years. However, while smoking is a personal choice, air pollution is not.
-
What is the 'Ozone and heat plan' in Belgium and what are the different phases?
Context
In 2003, Europe was struck by an extraordinary heat wave. Because of the high temperatures and ozone concentrations there was a sharp increase in morbidity and mortality in risk groups (elderly people, people with respiratory troubles).
In response to this heat wave, several countries set up action plans for heat waves in order to better control crisis situations like that in 2003. The goal of these plans is to be able to react quickly, in order to reduce the health impact of high temperatures and ozone concentrations on risk groups by taking appropriate measures.
In Belgium, it was decided to set up a national plan with thresholds for both temperature and ozone. Since the summer of 2005, this 'Ozone and heat plan' (further referred to as 'the plan') has been in operation. The definition of heat wave in the current plan is not the same as the one used by climatologists.
The different phases of the plan
The plan consists of 3 phases, of which the second phase, the warning phase is further divided into two levels:
- a vigilant phase
- a warning phase, subdivided into levels 1 and 2
- an alarm phaseThe warning and alarm phases kick in when a number of criteria are met. These criteria are based on results of 5-day weather forecasts, daily ozone measurements and 2-day ozone forecasts.
The first two phases of the plan, the vigilant and warning (level 1 and 2) phases are based on objective criteria (period, temperature and ozone concentration). The activation of the alarm phase, in contrast, requires additional assessment criteria ("the required actions for this phase are taken when the threshold has been reached and the measures already taken have to be intensified").
Before the alarm phase is activated, according to the original 2004 plan, a risk assessment group (RAG) is established. This RAG evaluates whether it is opportune to activate the alarm phase and if additional measures are needed. The suggestions and decisions of the RAG are then delivered to the risk management group (RMG) that is composed of representatives of the relevant authorities. The RMG eventually decides whether or not the alarm phase is activated. The heat and ozone criteria for the alarm phase were first reached in August 2020, the RAG and RMG were established and the alert phase declared on 8 August 2020.
The three possible phases of the plan are:
1. The vigilance phase
The vigilance phase starts on the 15th of May each year and ends on the 30th of September. This period is fixed and is therefore independent of weather conditions or air quality. From the 15th of May onwards, the actions are started systematically. As such, it is not dependent on a threshold, but on a period.
2. The warning phase
(Note: the criteria to trigger the warning phase were changed in 2017.)
The warning phase is triggered when the Tcumul is higher or equal to 17°C.
To calculate the Tcumul, the forecasted maximum temperatures in Uccle are used. The Tcumul is the sum of the difference between the 'maximum predicted temperature' and 25°C in Uccle for the following five days (D+1 to D+5). Here, only the positive differences are taken into account.
The warning phase ends when the Tcumul is below 17°C (on day D0) AND the predicted maximum temperature in Uccle on day D+1 is below 25°C.
3. The alarm phase
(Note: the criteria to trigger the alarm phase were changed in 2019.)
The alarm phase is triggered when:
the criteria for the warning phase are met
AND
a maximum temperature higher or equal to 28°C is forecast for the current day
AND
an exceedance of the European ozone information threshold of 180 μg/m³ was measured at at least one measurement site in Belgium the previous day
AND
for the current day, exceedances of the European ozone information threshold are predicted in a significant part of the country.
When the RMG decides to activate the alarm phase, the measures already taken are intensified.
SOURCE: Coordination protocol for the implementation of the "ozone and heat plan" between the Flemish, Walloon and Brussels Capital Regions and IRCEL.
-
Does an all-electric vehicle still cause air pollution?
Yes, electric vehicles cause emissions of particulate matter through wear and tear of tyres, brakes and road surface.
Traditional petrol and diesel vehicles cause emissions through combustion in the engine and through wear and tear on the tyres, brakes and road surface. Due to the absence of the combustion engine, an electric vehicle has no exhaust. In that respect electric vehicles have an advantage over cars with diesel, petrol, LPG or CNG engines. Emissions of NOx, CO and volatile organic compounds no longer occur in electric vehicles.Emissions of particulate matter as a result of wear and tear also occur in electric vehicles, however.
Due to increasingly stringent European emission standards (known as the EURO standards) and quality requirements for fuels, the exhaust emission of particulate matter from vehicles with combustion engines has decreased. As a result, the proportion of wear and tear emissions has increased and even become the dominant form. Total particulate emissions are thus in the same order of magnitude as for electric vehicles with wear emissions only.
Electric vehicles generally have a higher weight due to the heavy battery, so higher wear emissions are expected. On the other hand, the possibility of regenerative braking reduces wear. These effects cancel each other out; the exact net effect depends on the type of car and tyres, as well as driving behaviour.
The emission of particulates is only one of the environmental aspects on which a car can be judged. Commissioned by the Flemish Government, an eco-score has been developed that combines the impact of greenhouse gases, air pollutants and noise production in one indicator. The indicator can be consulted on ecoscore.be.
-
What is the difference between emission, concentration, exposure and deposition?
The distinction between 'emission', 'concentration', 'exposure' and 'deposition' is essential when talking about air quality.
'Emissions' refers to the amount of pollutants released from a particular source, such as factories, cars, power plants, fires and other activities or events. It can include various substances such as sulfur dioxide (SO₂), nitrogen dioxide (NO₂), carbon monoxide (CO), volatile organic compounds (VOCs) and particulate matter (PM₂.₅ and PM₁₀). Emissions are the direct release of these pollutants into the atmosphere and are expressed as the total mass of the substance released.
On the other hand, 'concentration' refers to the amount of pollutants actually present in the air at a given place and time. It measures the amount of pollutants per volume of air, often expressed in micrograms per cubic meter (µg/m³) or parts per million (ppm). Concentration is affected by factors such as emissions, atmospheric conditions (such as wind, temperature and precipitation) and the reactions between different pollutants in the air.
'Exposure' is a term used to indicate how much of a pollutant is actually inhaled or absorbed by individuals. Exposure takes into account not only the concentration at a location but also the number of people who live, work or are generally active there. In some cases, specific exposure of, for example, age categories, pregnant women or chronically ill people to a pollutant can be examined.
Finally, 'deposition' refers to the precipitation or deposition of pollutants from the air to the Earth's surface. It is the process by which pollutant particles or gases come down from the atmosphere and adhere to soil, vegetation, water and other surfaces. There are two main forms of deposition: dry deposition and wet deposition.
Dry deposition: This occurs when pollutants are deposited directly on the Earth's surface without the intervention of precipitation. Wind and gravity can carry particles downwards, where they land on soils, buildings or vegetation.
Wet deposition: This occurs via precipitation, such as rain or snow. Pollutants dissolve in raindrops and are carried to the ground. This can lead to the discharge of pollutants into surface waters or soils.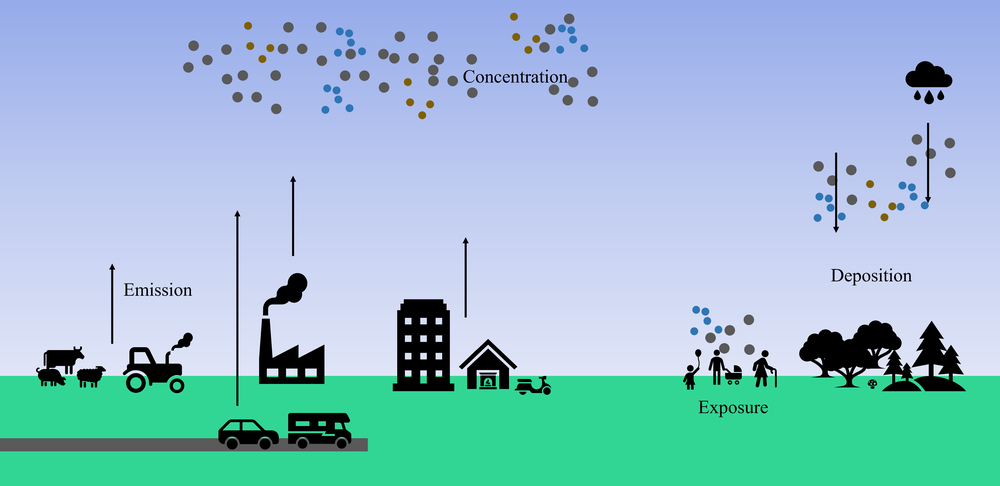
Figure: Conceptual representation of emissions from agriculture, transport, industry and buildings, concentration in the atmosphere, human exposure, and dry and wet deposition.
So, while 'emission' refers to the release of pollutants from sources, and 'concentration' focuses on the amount of those pollutants in the air at a given place and time, 'exposure' indicates how much of those pollutants are actually inhaled by individuals. When pollutants from the air end up on the ground surface, this is called 'deposition'. -
Can I use my weather applications to estimate air quality?
We believe it is important for everyone to have access to reliable air quality information. Therefore, we make the meteorological and air quality data collected in the measurement networks of the three regions freely available to the public. Several third parties, such as Apple and Google, use our data to display air quality information in their weather applications.
While we welcome the wider dissemination of this information, we have no control over how third parties process or visualise our data. This means that the way air quality information is used and displayed may vary by platform.
For the most accurate and official air quality data, we recommend using our own application: BelAIR. This app can be downloaded for free from the Apple App Store and Google Play Store. In addition, you can also access our air quality data directly on our website: www.irceline.be.
Want to be sure of accurate and up-to-date information? Visit www.irceline.be or download BelAIR and stay informed about air quality in your area.


