Is driving 90 km/h a drop in the ocean?
The effects of a speed reduction to 90 km/h during smog episodes in Flanders have been studied using a modelling apporach. This 90 km/h measure (SMOG90-measure) is applied on parts of the highway that pass through rather densely crowded areas (see figure 1 and 2 below). Through a coupling of several air quality models, the situation with and without the measure was simulated. Afterwards, the effect of the measure could be indicated by the difference between concentrations in both situations.
From this study, it is clear speed reductions during smog episodes do have a significant impact on air quality. The reduction of the PM10 and PM2.5 concentrations are limited to a couple of percents (see figures below) and are located in the immediate vicinity of the highways. For elementary carbon (EC) however, a significant reduction of 30% can be observed near these same highways, which is important. Elementary carbon is a measure for diesel soot, and an increasing amount of studies show that combustion-related particles, mainly originating from traffic exhausts, cause health effects (see figures 3, 4 and 5 below).
Another result of a speed reduction to 90 km/h is that it may lead to a decrease in elementary carbon of 5 to 10% in some locations up to 4 km away from the highway. Additionally, it was calculated that over 40 000 Flemish are being exposed to at least 10% less elementary carbon or diesel soot as a result of the speed limit. This decrease is even greater than 15% for over 7500 Flemish people. It is also striking that almost 1 million Flemish (1/6th of the population) live less than 1500 meters away from the highways and ringroads on which the speed reduction is introduced.
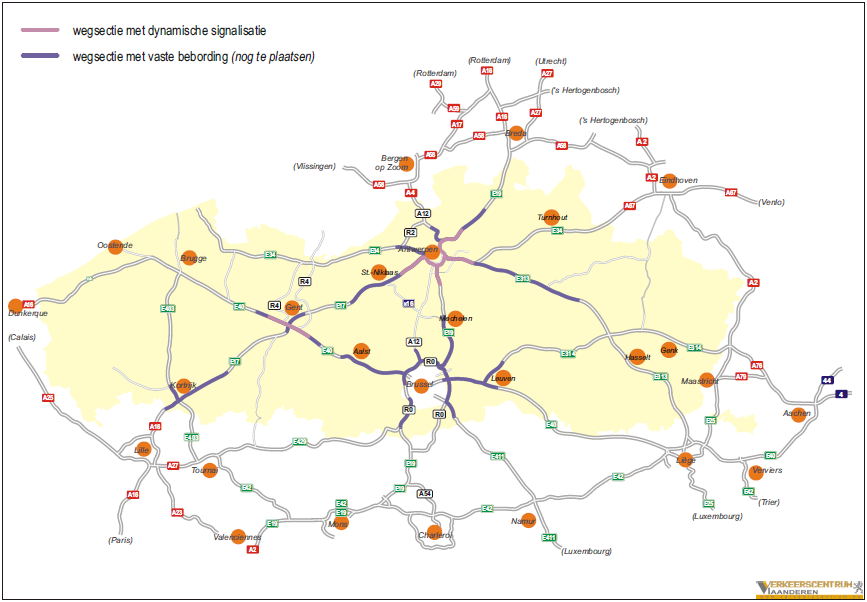
Figure 1: Road segments in Flanders on which the SMOG90-measure is applied.
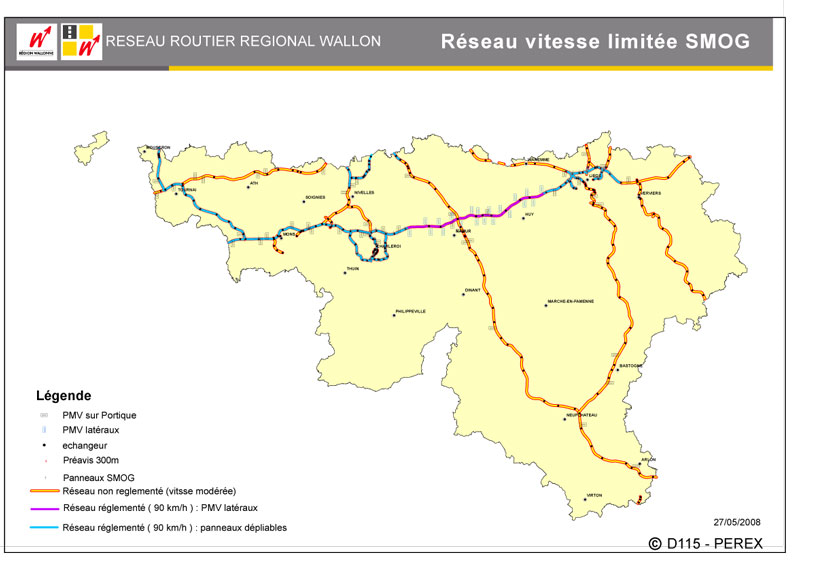
Figure 2: Road segments in Wallonia on which the SMOG90-measure is applied.
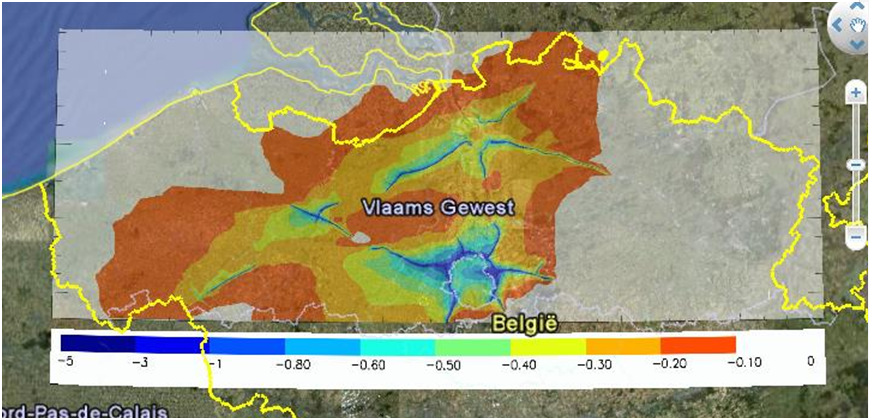
Figure 3: Influence of the SMOG90-measure on PM10.
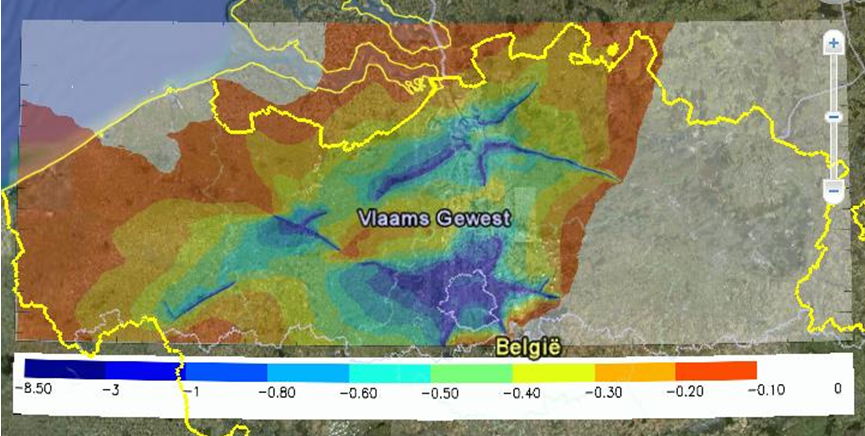
Figure 4: Influence of the SMOG90-measure on PM2.5.
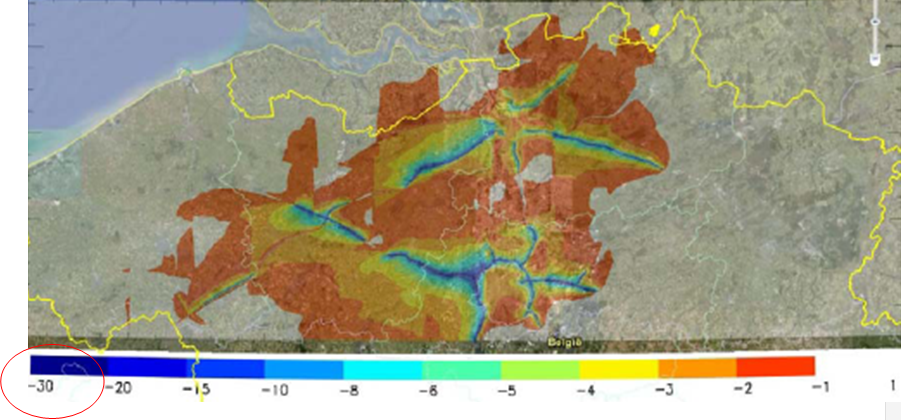
Figure 5: Influence of the SMOG90-measure on EC.
