AOT40 forest
O3 annual mean | NET60 | AOT60 | AOT40Veg | AOT40 forest
All data below are the result of the RIO interpolation technique, in which the measurement observations are interpolated to a 4x4 km² grid resolution. Locally, concentrations can be higher or lower.
The European Union has defined an excess indicator for the protection of vegetation and forests. The AOT40 for forests (= Accumulated Ozone exposure over a Threshold of 40 ppb (= 80 µg/m³)) is the accumulated excess of hourly ozone concentrations above 80 µg/m³ between 8:00 and 20:00 CET (Central European Time) over the period April-September. This indicator quantifies only ozone exposure, i.e. not the effective ozone uptake by (and therefor damage caused to) vegetation.
Spatial trend
The largest AOT40 for forests can be found in the southern and eastern part of the country, where also most forest resources are situated. The area south of the Sambre and Meuse valleys in particular has the heaviest ozone exposure. 37 % of the Belgian forests experienced AOT40 higher than the reference value of 20000 (µg/m³).u, averaged over 5 years. In practically all forest resources, ozone exposure is above the critical UNECE level of 10000 (µg/m³).u.
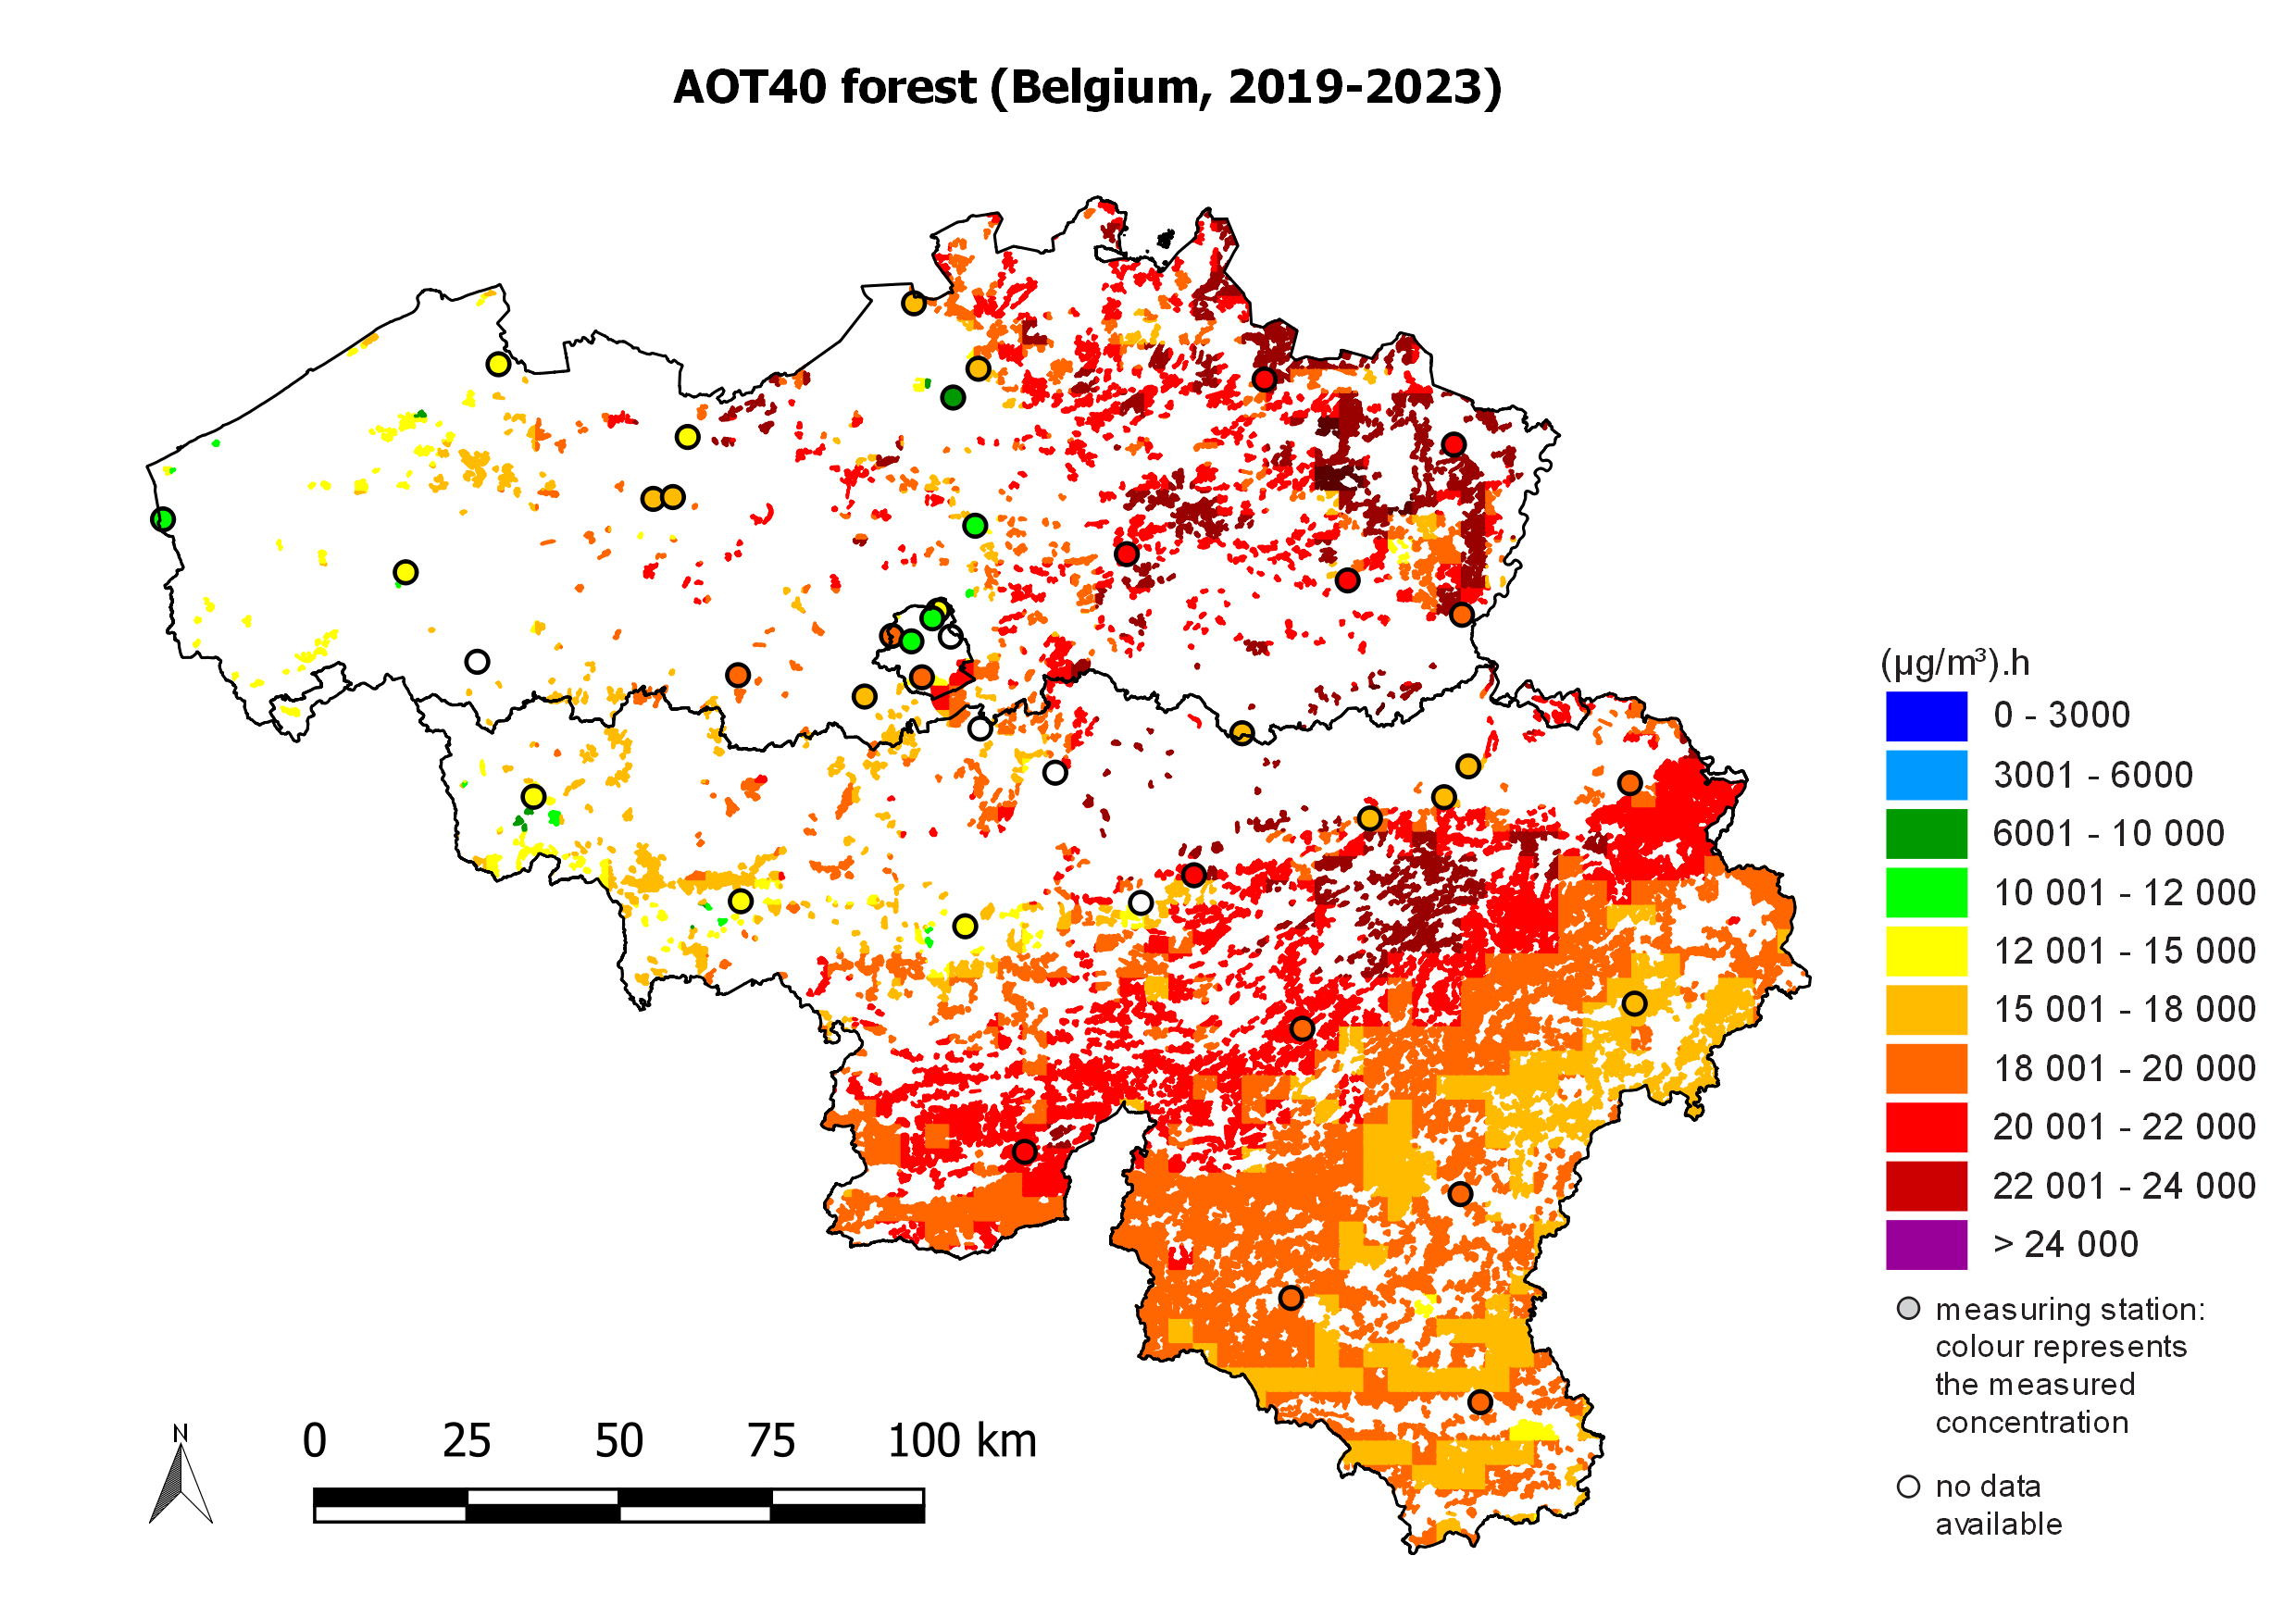
Spatial distribution of the ozone excess for forests (AOT40 for forests), 5-year average 2019-2023. 'No data' means that the data do not meet the criteria set out in 2008/50/EC Annex VII for aggregating the measurement data. All data were calculated using the RIO interpolation technique.