O₃ annual mean
O3 annual mean | NET60 | AOT60 | AOT40Veg
All data below are the result of the RIO interpolation technique, in which the measurement observations are interpolated to a 4x4 km² grid resolution. Locally, concentrations can be higher or lower.
Evolution of the percentiles
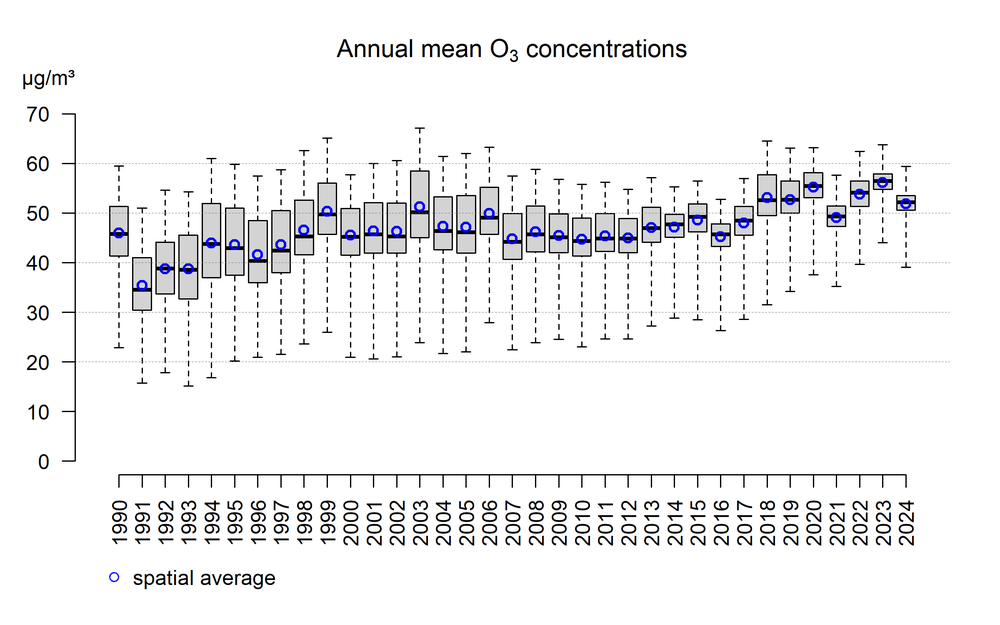
The figure below uses box plots to show the evolution of the minimum, the 25th percentile (P25), the 50th percentile (P50), the 75th percentile (P75) and the maximum annual mean O3 concentrations in Belgium. Between 1990 and 2000, the annual mean ozone concentrations show an upward trend. Between 2000 and 2017 the annual mean remained fairly constant, since 2017 an increase can be observed again.

Box plot of annual mean O3 concentrations over the period 1990–2024. The spatial average is represented by the blue circles. All data were calculated using the RIO interpolation technique.
Click here for more information on how to interpret a boxplot.
Evolution of regional averages
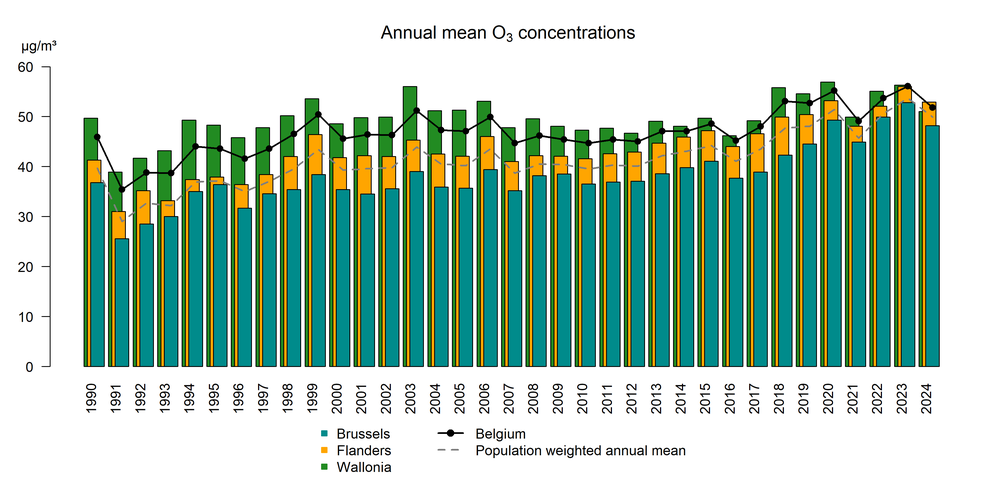
The figure below shows the evolution of the annual mean concentrations for Belgium and the three individual regions. Between 1990 and 2000, the annual mean ozone concentrations show an upward trend. From 2000 the curve remains fairly constant with values around 40 μg/m³, 45 μg/m³ and 50 μg/m³ in Brussels, Flanders and Wallonia respectively. However, since 2016, the annual average ozone concentration has been increasing for each of the regions, although 2021 was a very favourable ozone year. The population-weighted annual mean ozone concentration in Belgium is lower than the non-weighted mean.

Evolution of the annual mean concentration in Belgium and the three Regions based on the RIO interpolation technique
Spatial trends
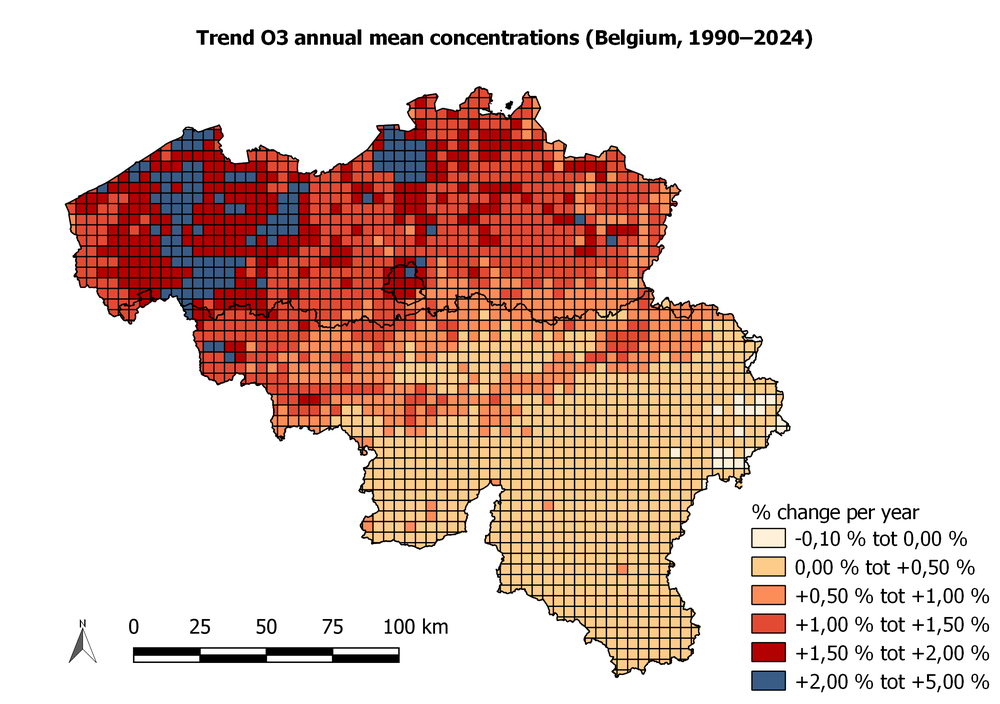
The spatial distribution of the increase in the O3 annual mean over the period 1990–2024 is shown in the figure below. Relative increases of more than 1% per year occur in Flanders and the cities in the Sambre and Meuse valleys. The largest increases are observed around the cities of Antwerp and Ghent and in West Flanders.

Spatial trend in annual mean O3 concentration (%/year) over the period 1990–2024. The data for the trend analysis were generated based on the RIO interpolation technique.
