NET60
O3 annual mean | NET60 | AOT60 | AOT40Veg | AOT40 forest
All data below are the result of the RIO interpolation technique, in which the measurement observations are interpolated to a 4x4 km² grid resolution. Locally, concentrations can be higher or lower.
The European target value for the protection of human health is based on the daily maximum 8-hour mean ozone concentration. Averaged over 3 years, this daily maximum 8-hour mean should not exceed 120 μg/m³ more than 25 times a year. This European target value is a medium-term objective (MTO) and applies since 2010 (average 2010–2012). The long-term objective (LTO) is not a single day with maximum 8-hour means above 120 μg/m³. This indicator is expressed as the NET60 indicator (Number of Exceedances above a Threshold of 60ppb (=120 µg/m³)).
Evolution of the percentiles
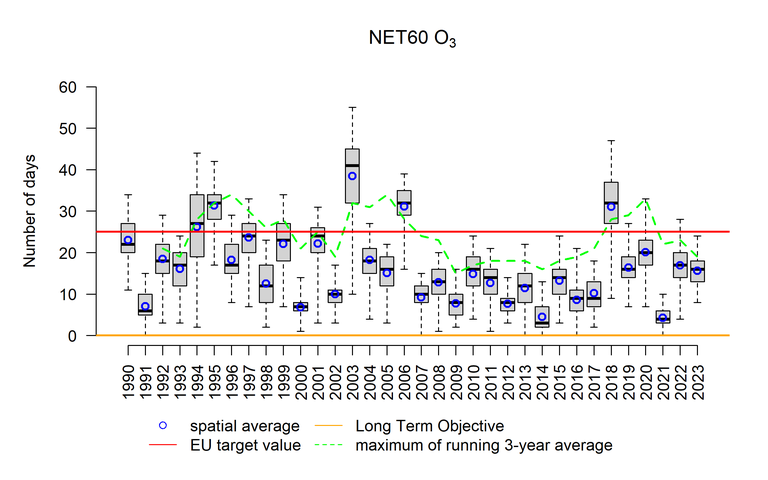
The figure below uses box plots to show the evolution of the minimum, the 25th percentile (P25), the 50th percentile (P50), the 75th percentile (P75) and the maximum number of days with a maximum 8-hour mean concentration above 120 μg/m³ reached in Belgium. The evolution of the number of days with the maximum 8-hour mean ozone concentration above 120 μg/m³ shows a strong variation from year to year, depending on the quality of the summer. No clear trend is apparent in the spatial average. The most unfavourable ozone year since 1990 is 2003 with a maximum of 55 exceedances in one grid cell. Thanks to the exceptionally low number of exceedances in 2021, the 3-year average fell below the European medium-term objective of 25 days.

Box plots of number of days with maximum 8-hour mean ozone concentrations > 120 μg/m³ in Belgium over the period 1990–2023. The spatial average is represented by the blue circles. The green dotted line indicates the maximum of the 3-year averaged number of exceedance days in Belgium. All data were calculated using the RIO interpolation technique.
Click here for more information on how to interpret a boxplot.
Spatial trend
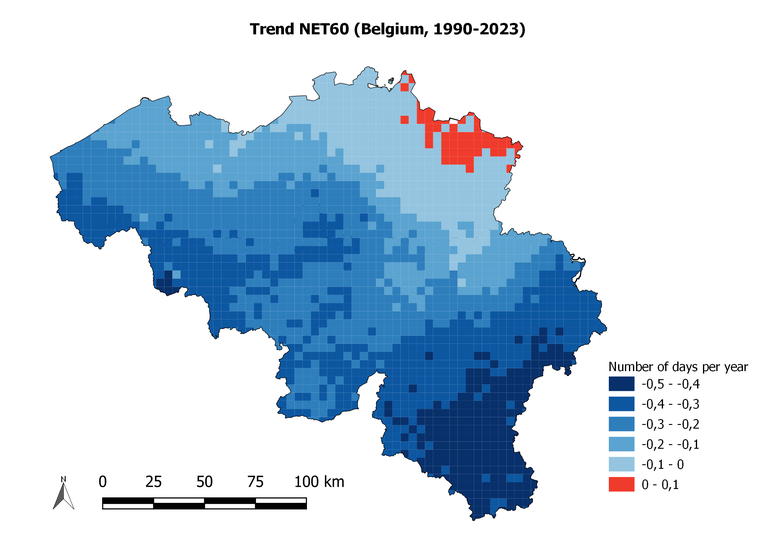
The figure below geographically represents the trend of the number of days with maximum 8-hour mean ozone concentration > 120μg/m³ during the period 1990–2023. A decrease in the number of violations of the threshold of 120 µg/m³ is visible for most of the country. The decline is less pronounced in the northeast of the country, a slight increase can even be observed in a part of the province of Limburg.

Trend of the number of days with maximum 8-hour mean ozone concentration above 120 μg/m³ (NET60) over the period 1990–2023 (number of days/year per year). All data were calculated using the RIO interpolation technique.


