AOT60
O3 annual mean | NET60 | AOT60 | AOT40Veg
All data below are the result of the RIO interpolation technique, in which the measurement observations are interpolated to a 4x4 km² grid resolution. Locally, concentrations can be higher or lower.
The AOT60 (= Accumulated Ozone Exposure above a Threshold of 60 ppb = (120 µg/m³)) is an indicator to assess the effects of ozone for the population. The AOT60 sums the difference between the concentrations above 120 μg/m³ and 120μg/m³ of the daily maximum 8-hour mean concentrations. In contrast to the NET60 indicator, the AOT60 considers the size and duration of the exceedance. In the draft version of the first ozone directive (2002/3/EC) and the National Emissions Ceilings Directive, 5800 (μg/m³).h was proposed as the medium-term objective (MTO) for 2010, which corresponds to a NET60 equal to 25 days. The long-term objective is 0 (μg/m³).h. The AOT60 was not incorporated into the current European Ambient Air Quality Directive, but is a better indicator to quantify the excess burden on public health.
Evolution of the percentiles
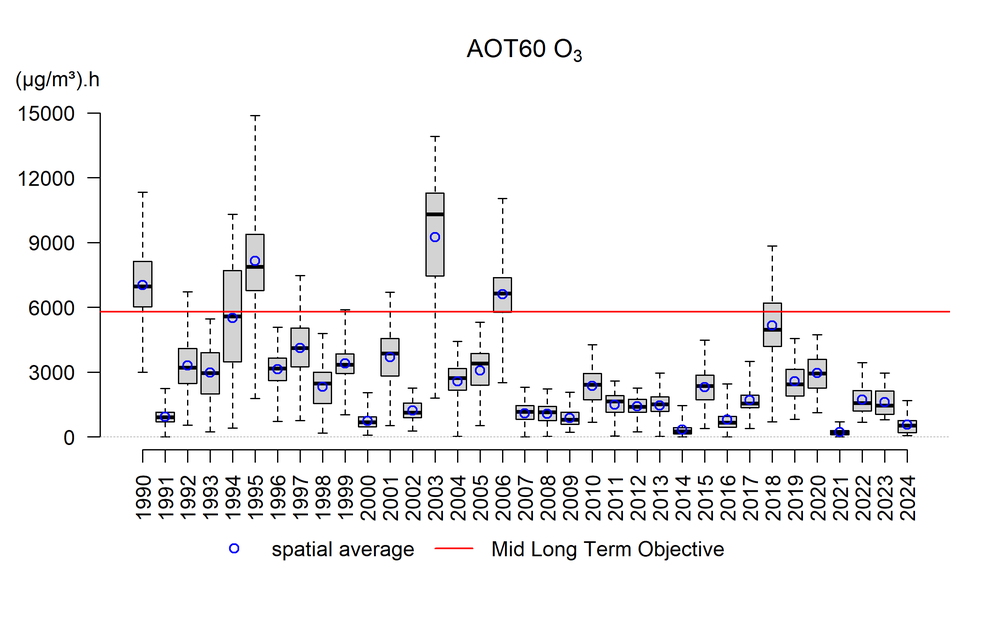
The figure below uses box plots to show the evolution of the minimum, the 25th percentile (P25), the 50th percentile (P50), the 75th percentile (P75) and the maximum of the AOT60 values for the Belgian population since 1990. The years '90, '94, '95, 2003, 2006 and 2018 immediately strike as unfavourable ozone years for the Belgian people. During these years, large parts of the country exceed the European treshold of 5800 (µg/m³).h. The long-term target of 0 (µg/m³).h was exceeded everywhere in Belgium in 2024.

Box plots of AOT60 in Belgium over the period 1990–2024. The spatial average is represented by the blue circles. All data were calculated using the RIO interpolation technique.
Click here for more information on how to interpret a boxplot.
