PM₁₀ annual mean
PM10 annual mean | PM10 daily mean | PM2.5 annual mean
All data below are the result of the RIO interpolation technique, in which the measurement observations are interpolated to a 4x4 km² grid resolution. Locally, concentrations can be higher or lower.
Evolution of the percentiles
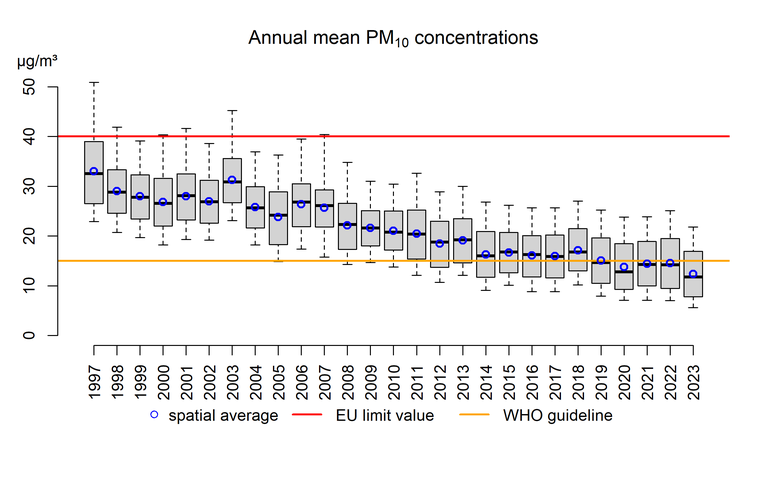
The figure below uses box plots to show the evolution of the minimum, the 25th percentile (P25), the 50th percentile (P50), the 75th percentile (P75) and the maximum annual mean PM10 concentrations in Belgium. It also shows the spatial average across Belgium by means of blue circles. All these parameters show a similar trend, therefore the distribution remains more or less equal over the entire period. The annual mean PM10 concentrations shows a downward trend from 2003, which has levelled out in the past few years. Since 2008, the European limit value has not been exceeded in Belgium. The WHO guideline value of 15 µg/m³, however, is still being exceeded in 36 % of the Belgian territory in 2023.

Box plots of the annual mean PM10 concentrations (µg/m³) over the period 1997-2023 in Belgium. The spatial average is represented by the blue circles. All data were calculated using the RIO interpolation technique.
Click here for more information how to interpret a boxplot.
Evolution of regional averages
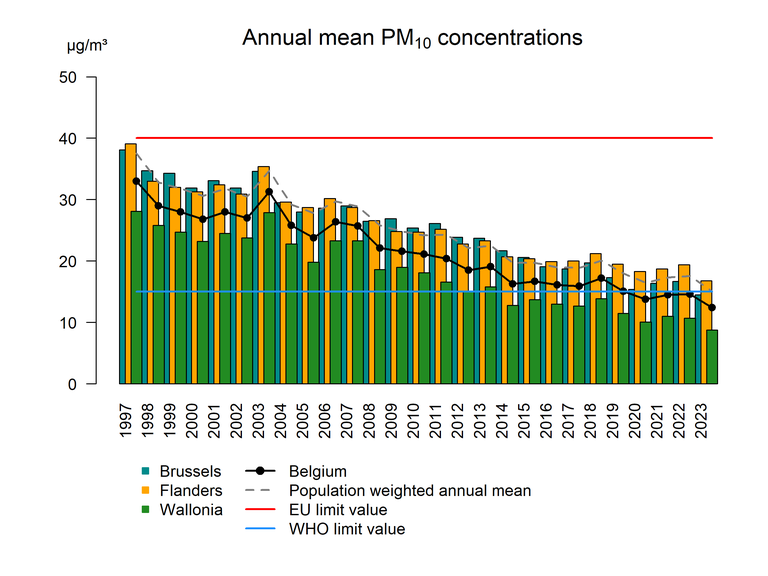
The evolution of the PM10 annual mean concentrations per region and for the entire Belgian area is given in the figure below. The annual mean PM10 concentration in 2023 for Brussels, Flanders and Wallonia are 14.5, 16.8 and 8.8 µg/m³ respectively. The population-weighted concentration, for which grid cells with a higher population density are given more weight in calculating the spatial average, is invariably higher than the Belgian annual mean PM10 concentration, for 2023 it equals 15.1 µg/m³.

Evolution of the spatially distributed annual mean PM10 concentration in Belgium and the three Regions and the population-weighted mean concentration for Belgium. All data were calculated using the RIO interpolation technique.
Spatial trends
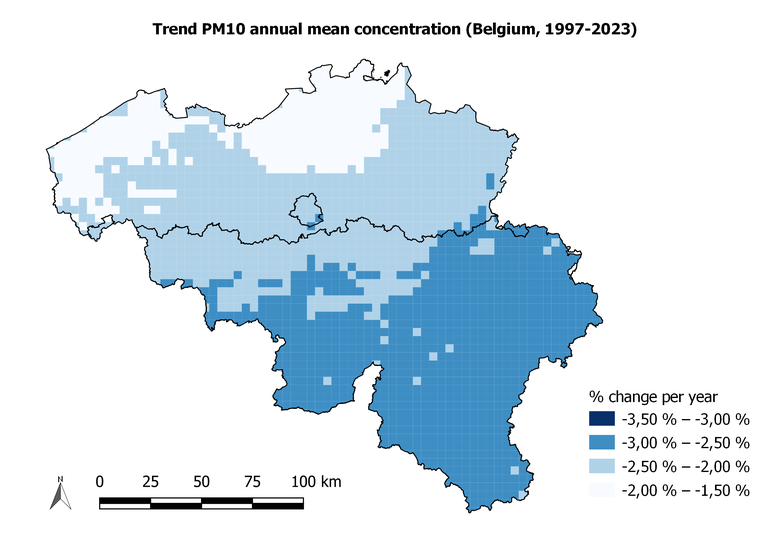
The spatial trend between 1997 and 2023 shows that during this period the PM10 annual mean concentrations have declined everywhere in Belgium. This decline seems to be slightly greater in Wallonia, between -2.0 and -3.0 % per year, than in Flanders, where it is mainly situated between -1.5 and -2.5 % per year. Here it should be noted that prior to 2008 only a limited number of PM10 monitoring stations were operational in Wallonia, which, additionally, were located mainly in industrial areas. This may give rise to an overestimation of the PM10 concentrations across the Walloon Region at the beginning of the period, so that the decline probably appears greater than it actually is.

Spatial trend in annual mean PM10 concentrations (% per year). All data were calculated using the RIO interpolation technique.


