Air quality in 2024: preliminary assessment
Introduction
This analysis provides a first preliminary estimate of the air quality in Belgium 2024 based on the measurements of three pollutants: nitrogen dioxide (NO2 ), particulate matter (PM2.5) and ozone (O3 ) in urban background monitoring sites. Urban background monitoring sites are sites where air quality is not determined by sources in the immediate vicinity but by all sources in the wider vicinity of the monitoring site. The measured concentrations at urban background locations provide a good picture of the average exposure of the urban population to air pollution.
Nitrogen dioxide (NO2 )
Nitrogen dioxide is a typical traffic-related air pollutant. At locations with a lot of traffic, there is a direct link between the NO2 concentrations and the local (diesel) traffic.
The figure below shows the annual average NO2 concentrations of the last 15 years (2010-2024) for 4 urban background locations in Antwerp, Ghent, Brussels and Charleroi.
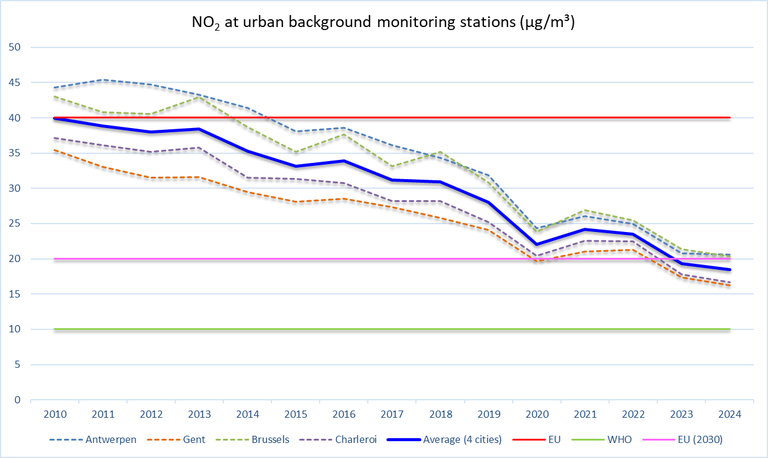
From 2014 onwards, we see a gradual downward trend that continues in 2024. The impact of the corona crisis is clearly visible in 2020. After the first corona year 2020, the concentrations (temporarily) increased again in 2021 and 2022. In 2024, the NO2 concentrations were, just as in 2023, lower than during the first corona year 2020. The concentrations were even slightly lower compared to 2023. Never before have the NO2 concentrations on urban background concentrations been as low as in 2024. There are a number of reasons for this:
- The reduction of nitrogen oxide (NOx) emissions in all sectors and in all EU countries
- Stricter emission standards specifically for car traffic and the decline of diesel cars in the (passenger) car fleet. Diesel cars emit more nitrogen oxides than petrol cars.
- The latest generation of diesel cars (EURO6d) emit significantly less NOx. This is the result of the introduction of “real-driving” emission tests in which cars are also tested in realistic driving conditions on the road and no longer just in the laboratory (although the emissions of a EURO6d diesel car are (on average) still higher than those of a comparable petrol car [1] )
- The introduction of low emission zones (LEZ) in a number of cities, where the oldest and most polluting cars are banned. A study by the independent health insurance funds [2] shows that in cities with a LEZ the decrease in NO2 concentrations is (slightly) higher.
- Specifically for 2024 it was a very wet year with a record amount of precipitation. The summer was also very wet and there were no heat waves. 2024 was therefore, just like 2023, a year with (very) favorable weather conditions for air quality. In "bad" weather with rain and wind, air pollution is well diluted, resulting in lower concentrations in the air.
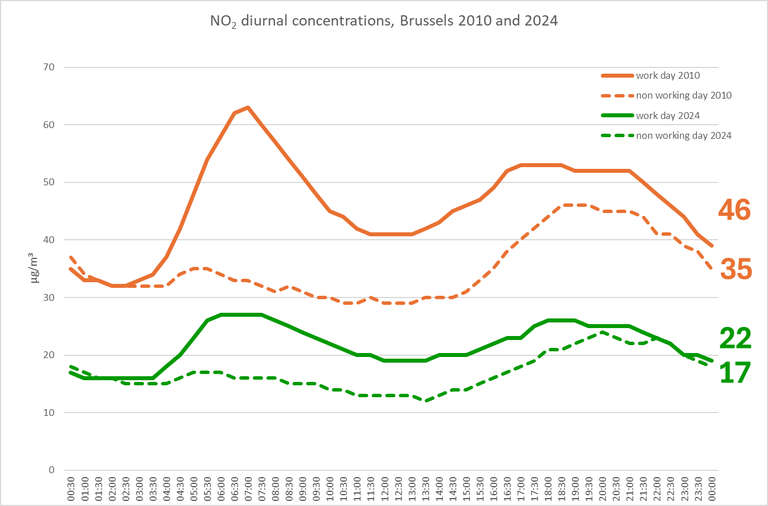
The fact that the impact of local traffic on nitrogen dioxide pollution is decreasing is also evident from the figure below. This figure shows the diurnal NO2 concentrations on a working day and a non-working day in 2010 and 15 years later in 2024. The NO2 concentrations are on average lower on a working day in 2024 than on a non-working day 15 years ago. The difference between a working day and a non-working day in 2010 was on average 11 µg/m³ and decreased almost 50% in 2024 (5 µg/m³). The decrease in NO2 concentrations in the air in the long term is clearly a consequence of a decrease in nitrogen oxide emissions.
The European limit value of 40 µg/m³ was not exceeded anywhere at the automatic measuring stations in 2024. It is not yet clear whether the European NO2 annual limit value is also respected in “street canyons” (streets surrounded by tall buildings) in large cities and along busy roads everywhere in Belgium. In Antwerp, Ghent and Brussels, measurements are also carried out with “passive samplers” at a number of busy traffic locations. Passive samplers can be used to measure the biweekly average NO2 concentration. However, the measurement results are not yet available for the entire year 2024 because these are not automatic measurements. However, because no exceedances of the NO2 limit value were measured with passive samplers in 2023, the risk that this will be the case in 2024 is small. Furthermore, high spatial resolution models are used to assess air quality in places where no measurements are available. Model results for 2024 will be available in the summer/autumn of 2025.
The more stringent annual guideline value of the World Health Organization (10 µg/m³) is only achieved in the most rural measuring stations in Flanders and south of the Sambre and Meuse valley. The (very) strict WHO daily guideline value (25 µg/m³) is only achieved in rural measuring stations in the Ardennes.
In October 2024, the European Parliament and the European Council approved a revised Air Quality Directive with stricter limit values (by 2030) compared to the current directive from 2008. The annual limit for NO2 has been lowered to 20 µg/m³. If this future limit value is not met in 2026, the European Member States will have to draw up a “roadmap” by 2028 at the latest with the measures that will be taken to meet the limit value from 2030 onwards. At urban background monitoring sites, the limit value that will come into force in 2030 will be met with a fairly high degree of certainty. At the busiest traffic locations, concentrations between 30 and 40 µg/m³ are currently still measured (passive samplers). Additional efforts will be needed to be in compliance with the European limit value of 20 µg/m³ at these busy traffic locations by 2030.
Table of nitrogen dioxide exceedances: https://www.irceline.be/en/air-quality/measurements/nitrogen-dioxide/exceedances
Particulate matter
The European annual limit values for PM10 (40 µg/m³) and PM2.5 (25 µg/m³) have long been respected at all measuring points. PM10 is fine dust with a diameter of less than 10 micrometers. PM2.5 is the even smaller fraction with a diameter of 2.5 micrometers.
The European daily limit value for fine dust is 50 µg/m³ (daily average concentration). This limit may not be exceeded for more than 35 days. In 2024, the daily limit was not exceeded at any measuring location. The highest number of measured exceedances of the daily limit was 9 (Sint-Kruiswinkel, Ghent). The lowest number of exceedances of the European daily limit was measured in all measuring stations since the limit value came into force in 2008. In more than half of the measuring stations, no exceedances were measured at all (in 2023, this was still the case in 18% of the measuring stations).
Over a longer period, the annual average concentrations have decreased, with a stagnation between 2020 and 2022. This is illustrated in the figure below with the annual average concentrations (PM2.5 ) based on measurements in 4 urban background measuring stations (Ghent, Antwerp, Brussels and Charleroi) between 2010 and 2024. The particulate matter concentrations in the 4 urban background measuring stations have never been as low as in 2024. This was also the case in almost all other measuring stations.
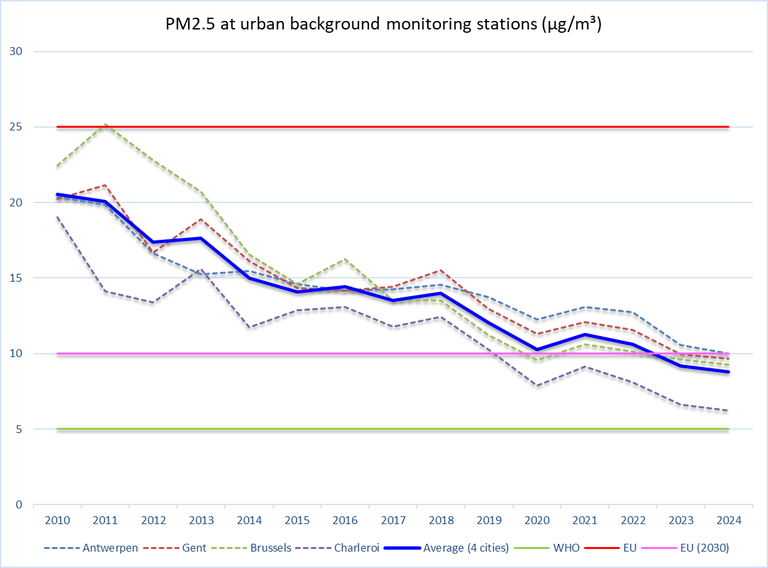
The reason for the favourable long-term trend are the decreasing emissions (at European level) of both primary (or directly emitted) particulate matter and of the pollutants (nitrogen oxides, ammonia and sulphur dioxide) that react in the atmosphere to form secondary (inorganic) particulate matter. As for NO2, the favourable weather conditions in 2024 are partly an explanation for the low concentrations in 2024.
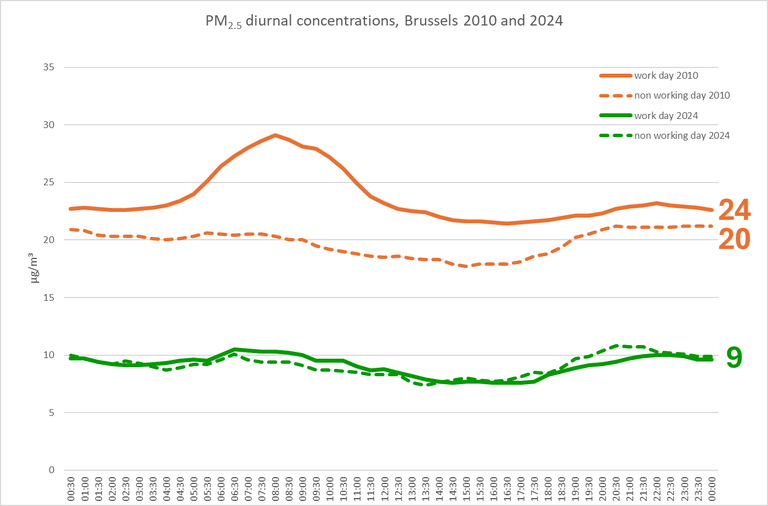
The impact of the local traffic contribution has also decreased significantly over a period of 15 years for PM2.5. This is illustrated by the figure below. The contribution of local (primary) particulate matter emissions to particulate matter concentrations is smaller compared to nitrogen oxides (see diurnal NO2 concentrations above). In 2024, there was no longer any difference between the average particulate matter concentrations (PM2.5 ) on a working day and a non-working day, which is an indication that the primary particulate matter emissions from local traffic have decreased very sharply due to the introduction of particulate filters and hardly contribute to the total mass of particulate matter concentrations in the air. Be careful, this does not mean that car traffic no longer contributes to particulate matter pollution: among other things, NOx emissions contribute to the formation of secondary particulate matter, which largely determines the (high) background concentrations. However, the formation of secondary particulate matter takes time and a temporary reduction in NOx emissions due to less car traffic on non-working days is not immediately reflected in lower particulate matter concentrations.
The current European annual limit value for PM 2.5 is 25 µg/m³. The new European directive introduces an annual limit of 10 µg/m³ in 2030. At most measuring points, the stricter EU limit by 2030 was already met in 2024. If the downward trend continues, the new annual limit will be respected at all measuring points by 2030. The stricter daily limit for PM10 (a maximum of 18 days per year with daily average concentrations higher than 45 µg/m³) and the newly introduced daily limit for PM .5 (a maximum of 18 days per year with daily average concentrations higher than 25 µg/m³) are also already being met (except at 1 measuring point).
The WHO annual guideline value for PM2.5 is 5 µg/m³. This annual guideline value is only achieved at 7 rural measuring stations in Wallonia (area below the Sambre and Meuse valley) and in 2 urban measuring stations in the Walloon region (Namur and Liège).
The (very) strict WHO daily guideline value for PM2.5 of 15 µg/m³, which may be exceeded for a maximum of 3 to 4 days per year, is not yet achieved anywhere in the country.
Although the fine dust concentrations have decreased significantly over the past 15 years, local sources such as wood stoves can cause short-term fine dust peaks locally. These peaks can also cause nuisance due to odour nuisance. Wood combustion is the most important source of (primary) fine dust.
Table with exceedances of fine dust: https://www.irceline.be/en/air-quality/measurements/particulate-matter/exceedances
Ozone (O3)
The summer of 2024 was very wet with significantly more precipitation than normal. At the beginning of the summer it was also somewhat cooler and gloomier than normal. Towards the end of the summer it was sunnier and warmer. Overall, the summer of 2024 was somewhat warmer and sunnier than on average.
There were 2 ozone days: one day in June (the 26th) and one in July (the 30th) . An ozone day is a day with an exceedance of the European information threshold of 180 µg/m³ at at least one measuring location in Belgium. There were no ozone days in August. Globally, 2024 was a year with few ozone days.
The decrease in emissions of nitrogen oxides (NOx) and volatile organic compounds (VOC) in recent decades on a European scale results in fewer and less intense ozone peaks. The number of ozone days and the intensity of ozone peaks decreased, under comparable (and even less favourable) weather conditions.
The ozone target value for the protection of human health (EU Directive 2008/50) is 120 µg/m³ as the highest 8-hour average of a day. This target value may not be exceeded for more than 25 days, averaged over a period of 3 years. The 3-year average in the period 2022-2024 remained below 25 days at all measuring points.
The WHO guideline value is 100 µg/m³ as the highest 8-hour average of a day and may only be exceeded 3 to 4 times per year. This guideline value is not achieved anywhere in Belgium.
Table with number of ozone days per month since 1979: https://www.irceline.be/en/air-quality/measurements/ozone/history/ozone-days/overview-since-1979/view?set_language=en
Summary
Air quality in 2024 was globally very similar to that in 2023. Nitrogen dioxide and particulate matter concentrations decreased slightly compared to 2023. The number of ozone days was also lower in 2024 compared to 2023. In the long term, air quality has improved significantly. New, stricter European limit values will come into force by 2030. These limit values are achievable, although additional measures will be needed to achieve the NO2 limit values in locations with a lot of car traffic. Achieving the WHO health advisory values in every location in Belgium is still far out of reach.
More info
This overview provides an initial (limited) analysis of air quality in 2024 based on the (not yet fully validated) measurement results of particulate matter, nitrogen dioxide and ozone. An extensive discussion of air quality in 2024 will be available in the course of 2025. The three regions will also publish reports and/or indicators with more information, also for pollutants other than those described above.
The evolution of air quality:
- in Flanders (VMM): https://www.vmm.be/lucht/evolutie-luchtkwaliteit/hoe-evolueert-de-luchtkwaliteit-in-vlaanderen
- In Wallonia (AWAC/ISSeP): https://www.wallonair.be/fr/publications/12-qualite-de-l-air-ambiant/4-wallonie-rapports-annuels.html
- In the Brussels-Capital Region (Bruxelles-Environnement): https://document.environnement.brussels/opac_css/index.php?lvl=notice_display&id=13025