NO₂ annual mean
NO2 annual mean | NO2 19th highest hourly mean
All data below are the result of the RIO interpolation technique, in which the measurement observations are interpolated to a 4x4 km² grid resolution. Locally, concentrations can be higher or lower.
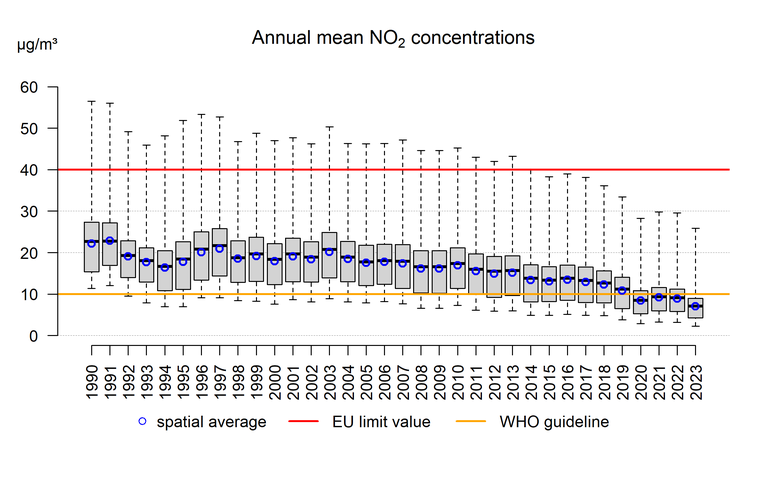
The European annual limit value for protection of human health is 40 μg/m³, which applies on the whole of Belgium since 2015. The highest annual means are measured in urban areas. This is not surprising given the strong traffic-related nature of NO2. Since 2014, there is not a single 4x4 km² grid cell in the whole of territory Belgium with an annual average above the European threshold of 40 μg/m³.
Evolution of the percentiles
The figure below uses box plots to show the evolution of the minimum, the 25th percentile (P25), the 50th percentile (P50), the 75th percentile (P75) and the maximum annual mean NO2 concentrations in Belgium. The spatial average is represented by blue circles.

Box plots of the annual mean NO2 concentrations (μg/m³) for the period 1990–2023. The spatial average is represented by the blue circles. All data were calculated using the RIO interpolation technique.
Click here for more information on how to interpret a boxplot.
Evolution of regional averages
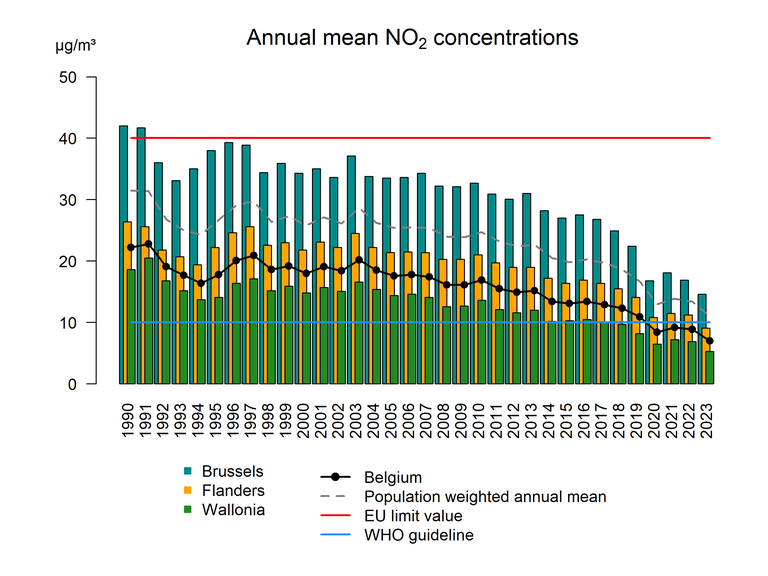
In 2023, the highest NO2 annual mean of all Belgian grid cells was 25,9 µg/m³. The average annual mean concentrations across Flanders, Brussels and Wallonia were 9.1 µg/m³, 14.6 µg/m³ and 5.3 µg/m³ respectively. The average across Belgium, taking account of the number of inhabitants per grid cell (population-weighted average) is 11.0 µg/m³. This value clearly exceeds the non-population-weighted average across Belgium (7.0 µg/m³), which indicates that the grid cells with the highest population numbers are also those with higher NO2 annual mean concentrations, namely the urban areas.

Evolution of the NO2 annual mean in Belgium based on the RIO interpolation technique.
Spatial trends
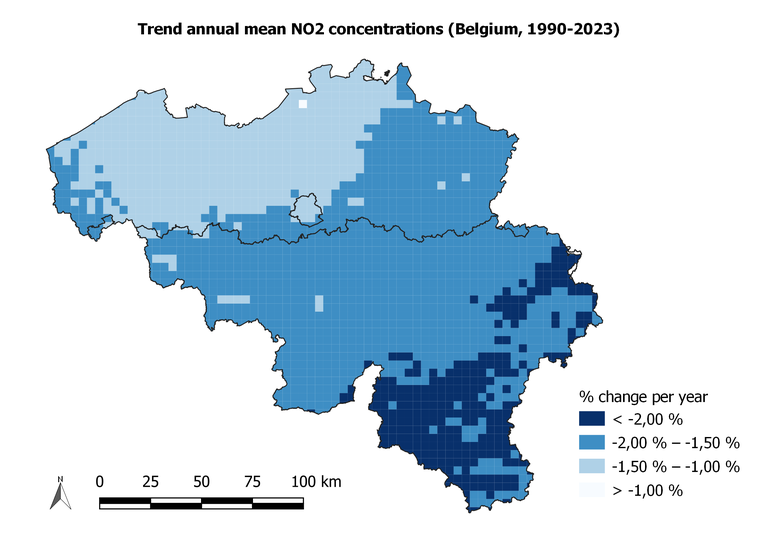
The decrease in the annual mean NO2 concentrations in Belgium over the period 1990–2023 is rather limited. The largest decreases - between 2.0 and 2.2 % per year - occur in the south of the country.

Trend (% per year) of the annual mean NO2 concentrations in the period 1990–2023. All data were calculated using the RIO interpolation technique.


